
Metrics configurations define the telemetry campaigns that the Telemetry
service runs. A metrics configuration is an instance of a MetricsConfig
protocol buffer (protobuf) message. Metrics configurations specify how to
collect, process, and report data. OEMs can activate metrics configurations
through the Telemetry service's API. Multiple configurations can run
concurrently.
Before you begin, familiarize yourself with the SDV architecture, which is a service-oriented architecture that services publish data as protobuf messages. These messages communicate using the SDV communication stack through RPC or publish-subscribe.
Key terms
A metrics configuration orchestrates data collection by defining data sources, processing rules, and reporting mechanisms. One of the main benefits of this edge processing is reduced mobile data usage. By processing high-frequency data on the device and uploading only aggregates or insights, you significantly reduce the amount of data transmitted to the cloud.
The definition of a metrics configuration begins by listing data sources to use in the configuration. These are services that make data available through the SDV communication stack. When you activate a configuration, the Telemetry service connects to these sources to stream or fetch data as needed.
The core of a configuration is its edge data processing capability, managed through stateful data aggregators. Each aggregator uses a message builder that maintains a stateful proto message instance. Each field in this message is populated by evaluating an expression, defining which data to read from other data sources or aggregators and which mathematical, logical, or aggregation operations to apply to the data. You can apply additional aggregations to the result of an expression.
Triggers are central to controlling this process. They can fire periodically, in response to new data, or when data-based conditions are met. Triggers dictate when aggregators evaluate their message builder, when metrics reports are generated, and can influence the configuration lifecycle, for example, by starting or stopping data collection.
Metrics reports are the final output. Each report includes the data payload defined by a message builder, along with metadata such as timestamps and report ID. You can generate reports at specific configuration lifecycle moments, such as when a configuration is activated or deactivated. Generated reports are stored in memory, and the client is notified for retrieval through the report status notification channel.
The following figure provides a conceptual example of how components can interact within a metrics configuration:

Figure 1. Data sources, processing, and reporting within a metrics configuration.
Metrics configuration components
You can use metrics configurations to define data collection tasks and complex on-device processing pipelines. This section details the core components used to define a metrics campaign. The components are presented in the order that data flows through the system, from input to output. You can define these components in any order. Processing data with aggregators and lifecycle management are optional.
- Define data sources
- Process data with aggregators
- Control execution flow with triggers
- Generate metrics reports
- Manage the data collection lifecycle
Define data sources
The foundation of any metrics campaign is data. In a metrics configuration, the mechanism of receiving data is abstracted and you need to specify only the name by which a data source can be identified and the mode of connection (subscription or on demand). Data sources can be any service that makes data available through the SDV communications stack or registers itself in the Configurable Publisher Registry, which enables data collection from apps where SDV middleware is unavailable. Each data source must have a unique name within the configuration so that it can be referenced by other metrics configuration components like triggers or aggregators. You can configure how it connects, how often it receives data, and provide a service-specific configuration object.
Configuration of data sources
The Telemetry service can connect to a data source in two ways:
- Getter: This method fetches data on demand whenever an expression defined in the metrics configuration needs to read data from this source. This is useful for data sources that don't provide a continuous stream or when you need infrequent snapshots of data.
- Subscription: This is the default method. It establishes a continuous data stream from the source. This connection type is required if you intend to use a data trigger that triggers when new messages arrive from this source.
When you use a subscription, you can configure:
- Subsampling: To avoid ingesting data too frequently, you can define a minimum time interval between consecutive messages from the same source. If the source publishes data faster than this interval, the Telemetry service throttles the notifications, and data triggers activate only for messages received after throttling. This effectively subsamples the data.
- Initial message retrieval: You can configure the service to retrieve the most recent message from the source when it establishes the subscription. As a result, the data source is populated with a value immediately if one is available, rather than waiting for the first new message to be published. This is useful in conditional triggers or aggregators that require an initial state or when the data source publishes infrequently.
Regardless of type, messages are cached internally. If multiple expressions or aggregators require data from the same source during a single evaluation cycle, the system fetches the data only once, either from the cache if a new message arrived using a subscription, or using a single on-demand call.
Process data with aggregators
While data sources provide raw data, aggregators perform stateful, edge data processing. They consume data from data sources or other aggregators, transform it, and make the result available to be read by metrics reports or processed further by other aggregators. This makes it possible to build multi-stage processing pipelines, for example, calculating speed statistics in one aggregator and using those statistics in another component that detects driving behavior patterns.
Aggregators are triggered to perform their calculations by one or more triggers. Each time one of its triggers fires, the aggregator evaluates its rules and updates its internal state.
You can configure an aggregator to reset its state after its value has been read by another component, which is useful for calculating statistics over non-overlapping time windows.
A message builder defines the structure and logic of an aggregator. A message builder specifies how to construct an instance of a proto message by describing how to generate data for each of its fields. For each field, an expression defines how to read data from data sources and aggregators and apply operations to this data. Additionally, you can apply an aggregation, which is a calculation or collection operation applied to the results of the expression over time.
The following aggregation types are supported:
- Mathematical: Calculates statistics (average, minimum, maximum, sum, standard deviation, and delta) over the values returned by an expression on each trigger. Delta is the difference between the current and previous numeric value returned by an expression.
- List: Collects values returned by an expression into a list. You can limit the list size to create a rolling window (ring buffer) of recent values.
- Count: Special case where no expression is specified. Counts how many times the field is evaluated (that is, how many times the aggregator or report is triggered).
- Passthrough: Uses the result of an expression directly, without applying an aggregation. This is useful in report configurations for accessing final values from aggregators.
The following figure is a conceptual diagram illustrating aggregator evaluation:
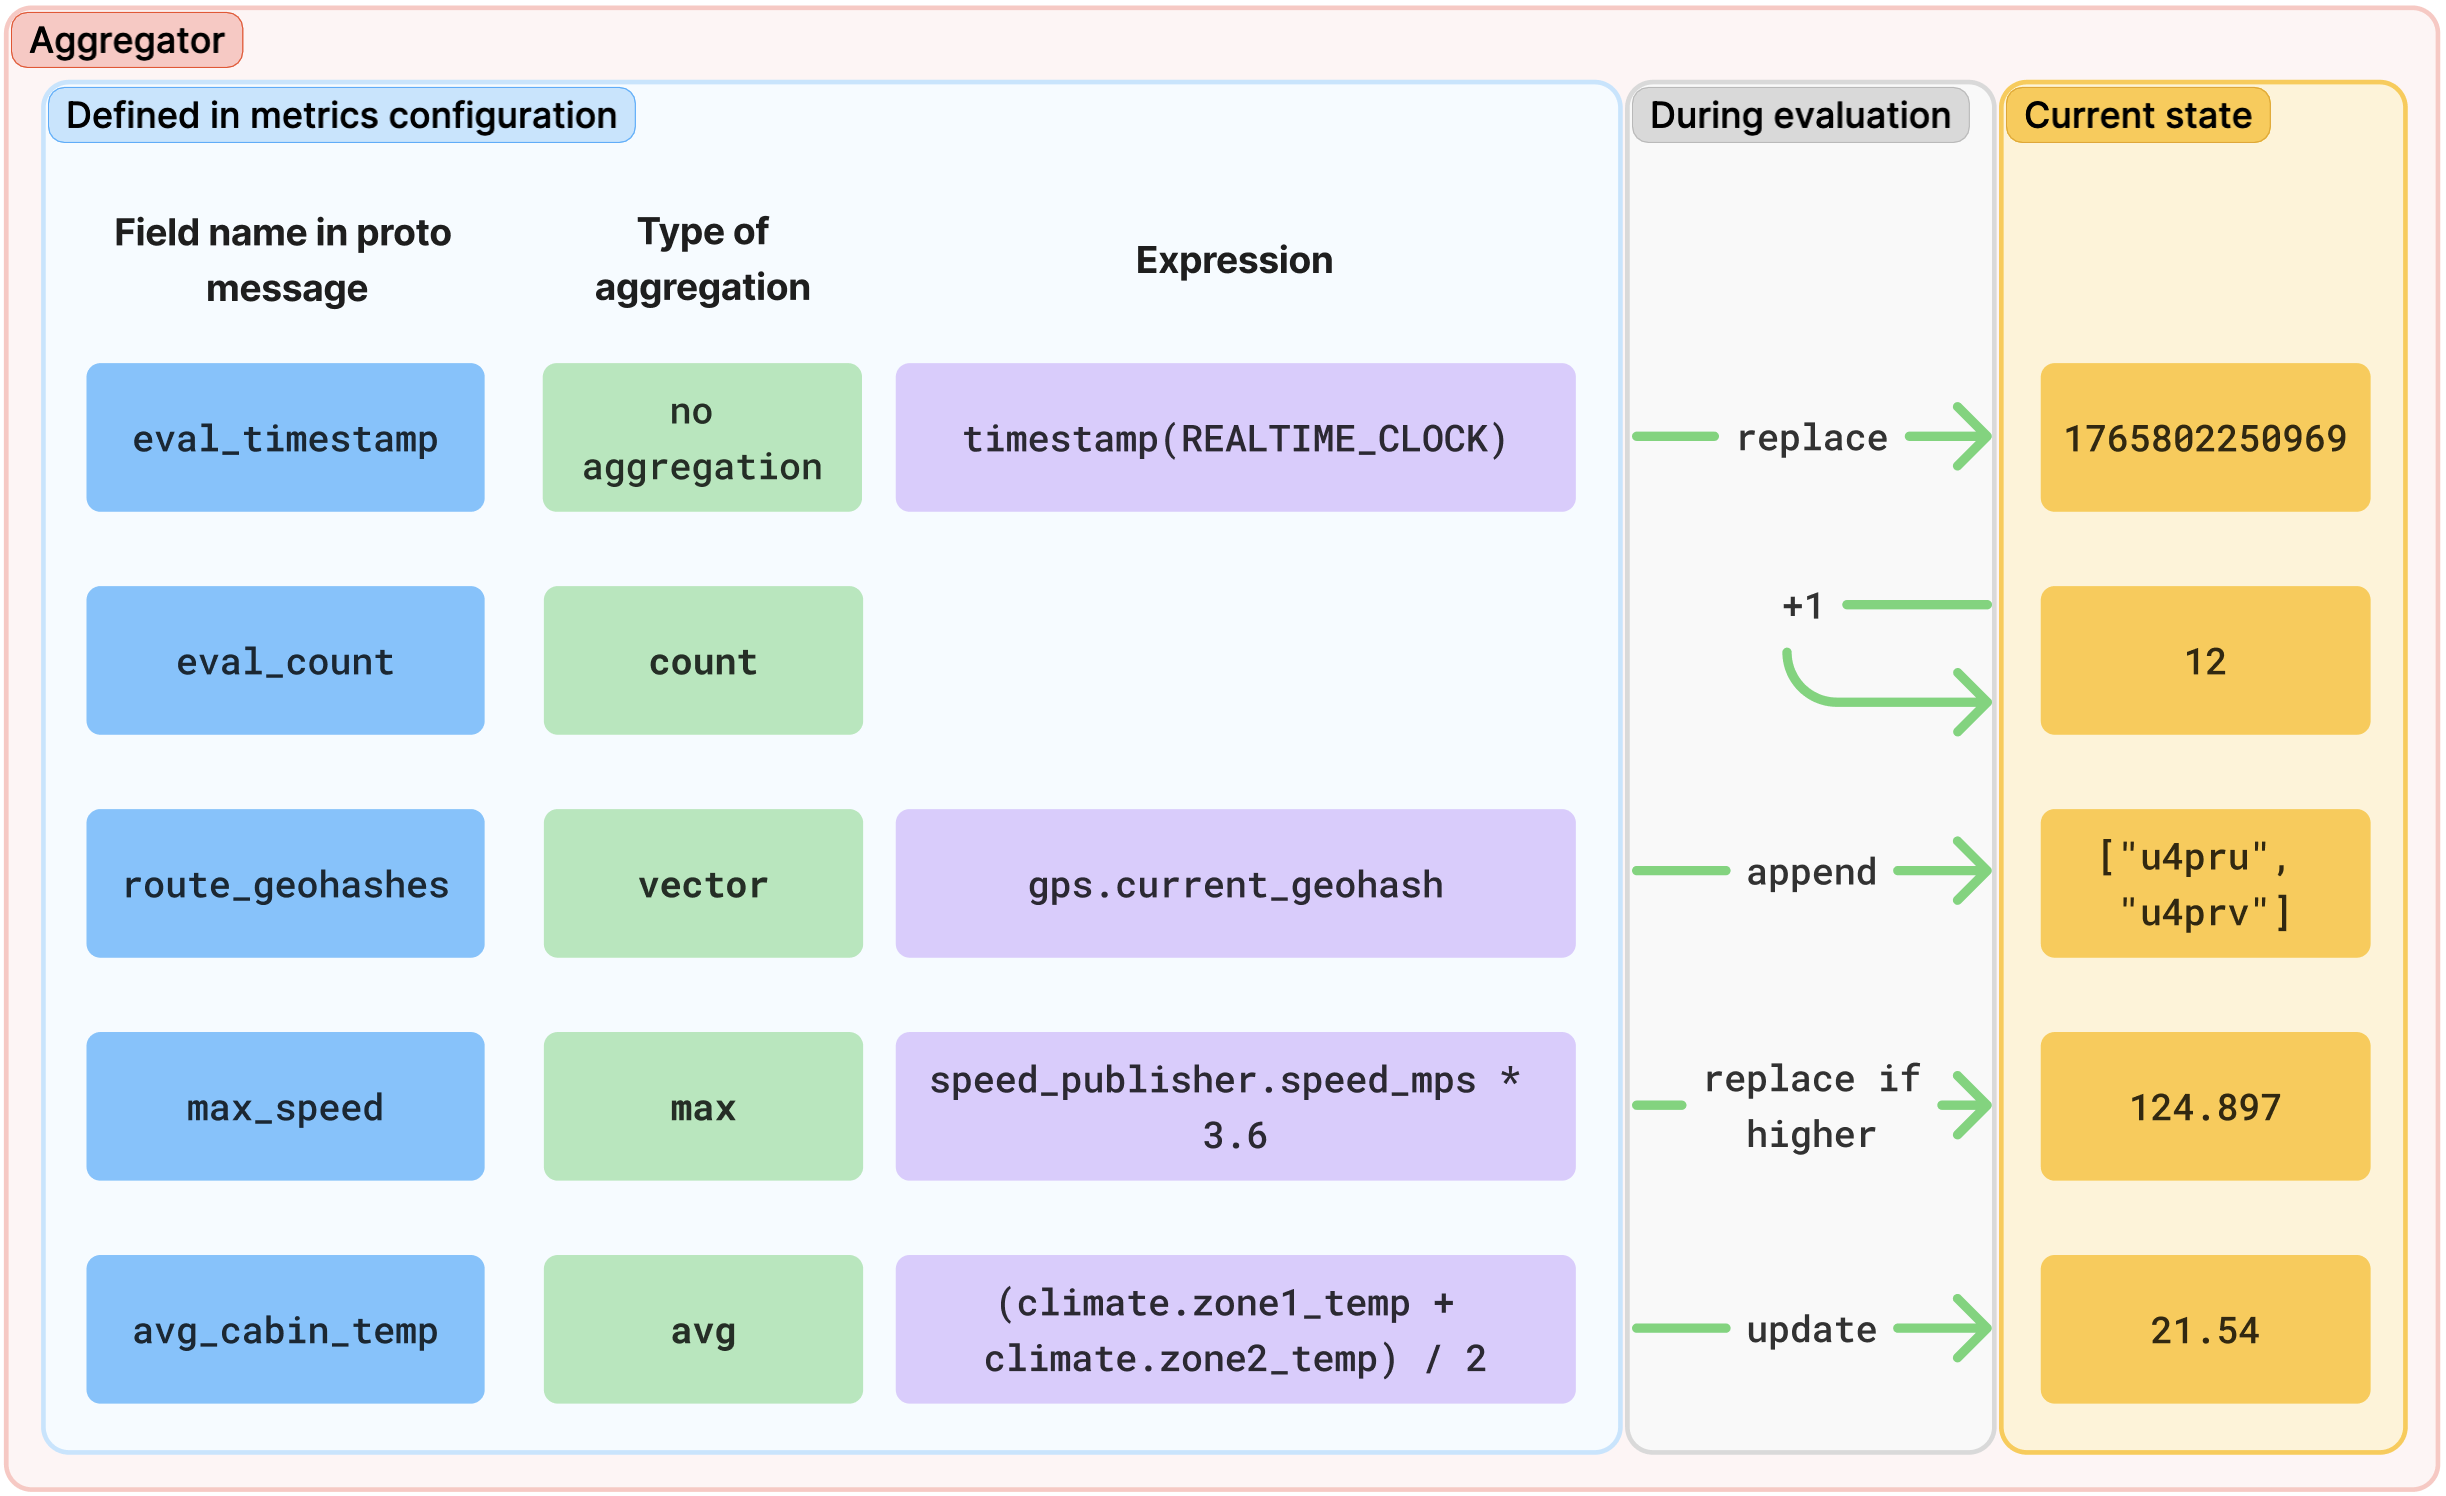
Figure 2. Aggregator evaluation.
Perform calculations or define conditions using expressions
Expressions are used within message builders and conditional triggers to perform
calculations or define conditions. When using the Metrics Configuration
Generator (MCG) to author Metrics Configuration JSON objects, expressions are
written as human-readable strings that use dot notation to access fields of data
source (for example, vehicle_speed.speed_value) and apply a wide range of
operations. MCG translates these strings into an optimized tree structure,
analogous to an abstract syntax tree (AST), for efficient on-device evaluation
in the final MetricsConfig protobuf message.
Operators and functions
Expressions support the following set of operators and functions:
- Arithmetic: Supports addition, subtraction (binary and unary), multiplication, division, modulo, and power.
- Logical: Supports AND, OR, NOT, and XOR.
- Relational: Supports equality checking and greater than and less than comparison.
- List: Checks if a list does or doesn't contain a specific value.
- Timestamp: Returns the timestamp at the time of evaluation in microseconds. The clock type can be realtime clock, monotonic time since boot (including suspend time), or monotonic time since boot or last resume.
- Absolute value: Returns the absolute value of a number.
- Rounding: Rounds to the nearest integer (
round), returns the largest integer less than or equal to a number (floor), or returns the smallest integer greater than or equal to a number (ceil).
Here is an example expression that reads from two data sources and evaluates to
true if the vehicle speed exceeds 100 kmph and there is no tire pressure
warning:
(vehicle_speed.speed_value * 3.6) > 100 && tire_pressure.warning == false
Control execution flow with triggers
Triggers are the orchestrators of a metrics configuration; they control when data is processed and when reports are generated. Each trigger must have a unique name.
There are three types of triggers:
- Data triggers: Fire when a data source with a subscription connection publishes a new message (after subsampling, if configured).
- Periodic triggers: Fire at a fixed time interval.
- Conditional triggers: Fire when a specified logical condition is met.
Conditional triggers
Conditional triggers listen to other triggers (data, periodic, or other conditional triggers) and, when one of those triggers fires, evaluate an expression. The conditional trigger fires only if the expression's result meets a specific condition.
You can configure a conditional trigger to fire based on several condition types:
- Value: When the expression evaluates to
true(or non-zero) orfalse(or zero). - Rising edge: When a boolean expression changes from
falsetotrue, or a numeric value increases. - Falling edge: When a boolean expression changes from
truetofalse, or a numeric value decreases. - On change: Whenever the expression's result is different from its previous value.
Filter noisy state changes
For edge-based or on-change triggers, you can filter out brief or noisy state changes (glitches) by requiring the condition to remain in the new state for a minimum duration before the trigger fires.
For example, you can configure a trigger to fire only if vehicle_speed > 100
becomes true and stays true for at least 5 seconds. This prevents the
trigger from firing due to a momentary spike in the speed reading. You can also
require that all values seen during this hold duration are exactly equal.
Generate metrics reports
After the data is processed, you define how and when it is packaged into reports.
Reports are defined using metrics report configurations, which use message builders to define the structure and content of their output. When one of the report's triggers fires, the message builder evaluates its field assignments to construct the data payload of the report.
Each generated report is an instance of a MetricsReport Protobuf message,
which wraps the output of the message builder in a payload field and adds
metadata. The Telemetry service automatically adds the following metadata to
each MetricsReport:
- A universally unique identifier (UUID) for the report
- A sequential report number, which increments for each report generated by this report configuration
- The timestamp of when the report was generated
- The reason for generation (for example, triggered by a rule, or generated on shutdown)
- The UUID and version of the metrics configuration that generated the report
- The name of the metrics report configuration
Report generation control
While reports are typically generated in response to triggers, you can also configure them to generate at specific lifecycle moments of the metrics configuration:
- Report on activation: If enabled, the system generates an initial report immediately when the metrics configuration is activated.
- Final report: If enabled, the system generates a final report when data collection is paused or stopped, or when the Telemetry service shuts down. This report contains the data aggregated up to that point, helping ensure that no data is lost at the end of a session.
Manage the data collection lifecycle
By default, a metrics configuration begins collecting and processing data as soon as it's activated by a client and continues until it's deactivated by the client. However, you can control this lifecycle more granularly by defining triggers that start or stop data collection or metrics configuration:
- Start trigger: If defined, data collection begins only when this trigger fires. If collection has been paused by a stop trigger, the start trigger resumes it.
- Stop trigger: If defined, this trigger pauses data collection. Aggregations and report generation stop until the start trigger fires again.
- Deactivate trigger: This trigger deactivates the metrics configuration
the same way a
deactivate_metrics_configcall from the client would.
For example, you can define a conditional trigger that fires when
vehicle_state changes to DRIVING as the start trigger, and another that
fires when vehicle_state changes to PARKED as the stop trigger. This helps
ensure that data is collected only while the vehicle is in motion.