After downloading and running the MATLAB files, use the following flowcharts to analyze the waveform files recorded in the previous step.
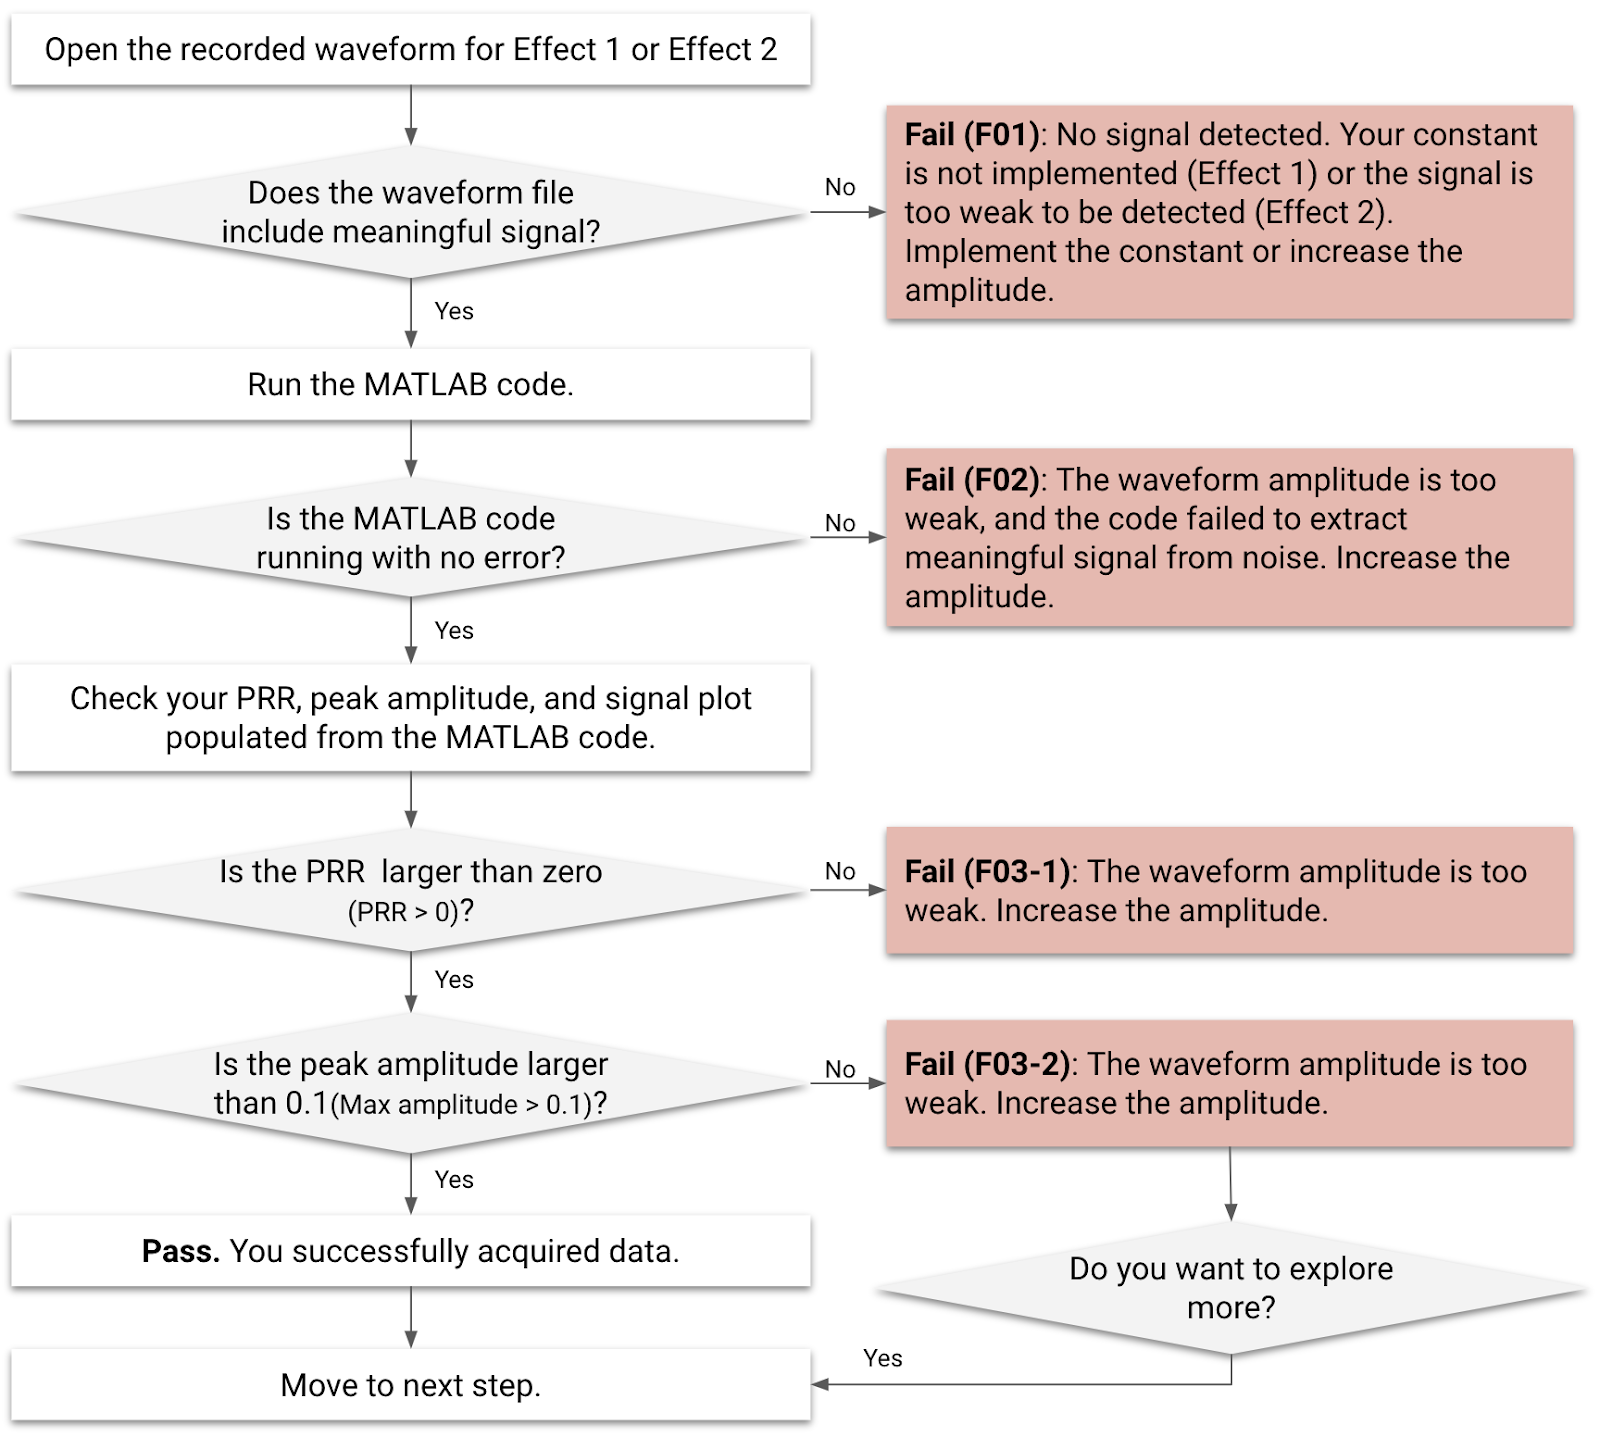
Figure 1. Waveform analysis flowchart for Effect 1 and Effect 2
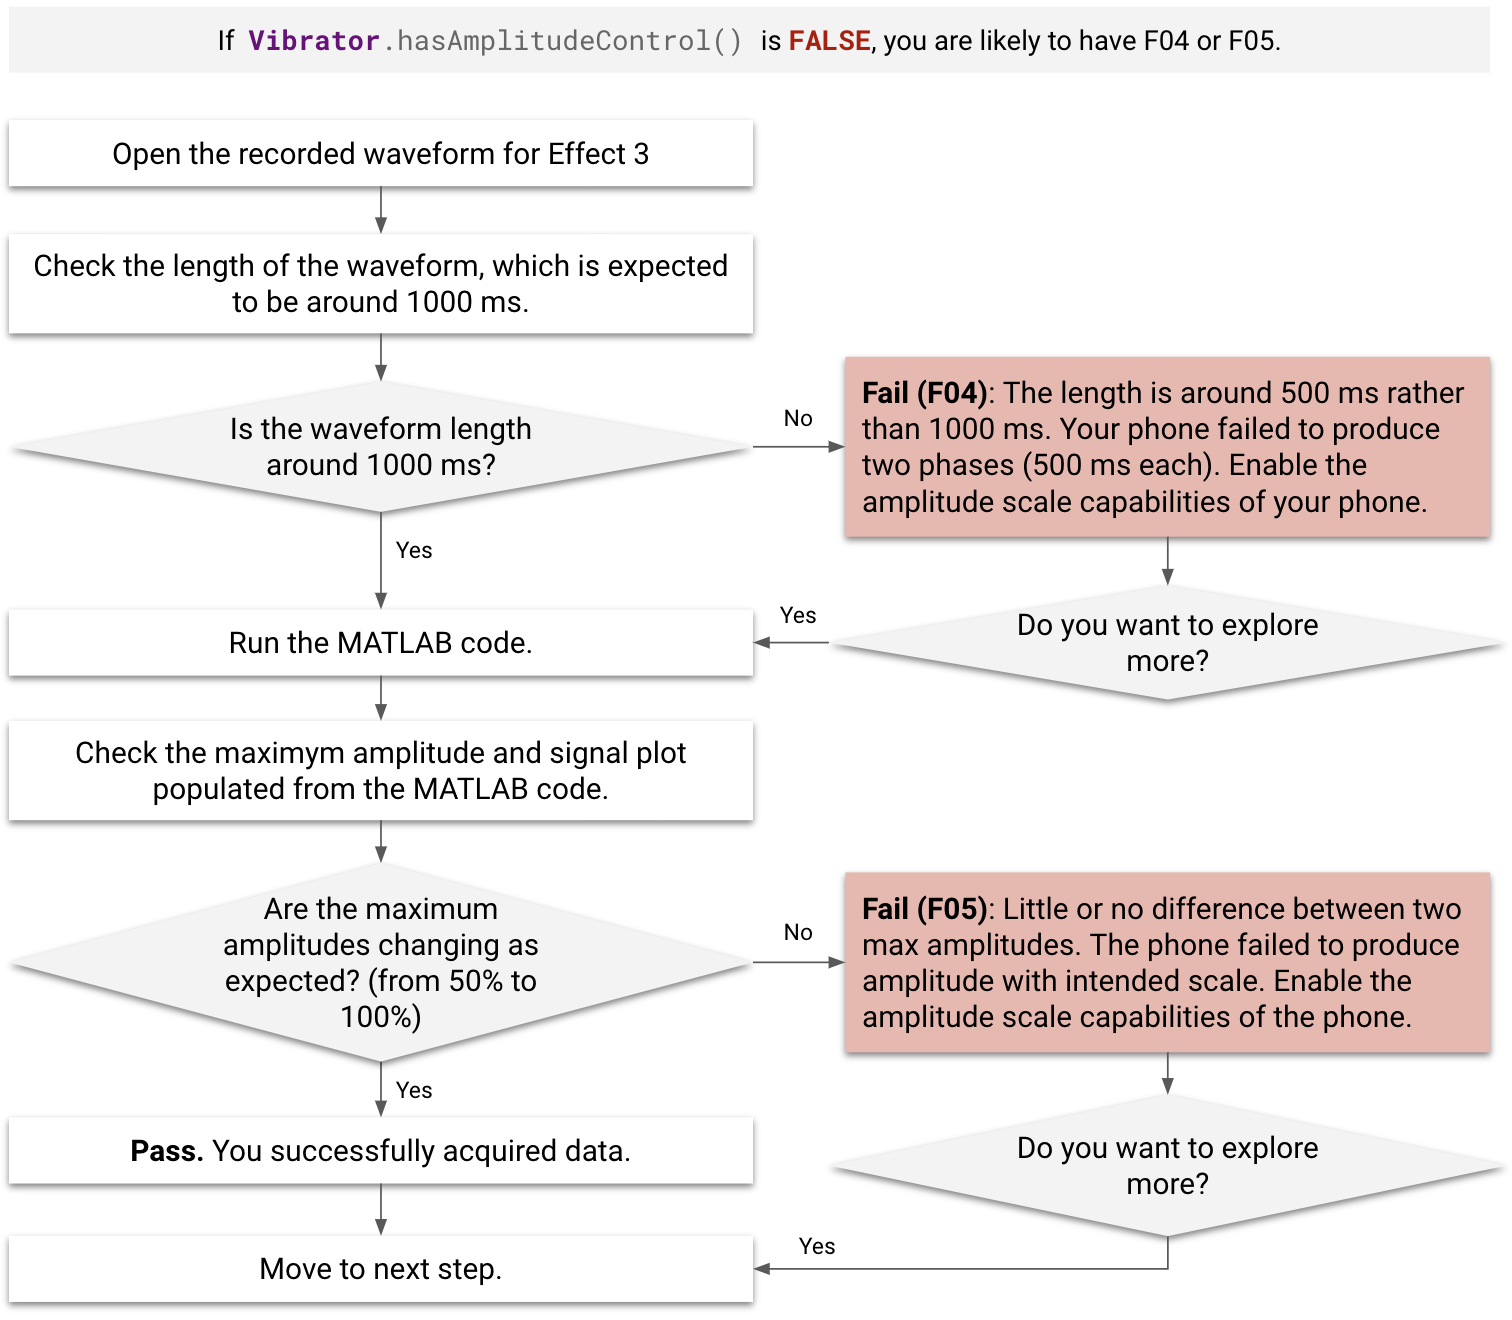
Figure 2. Waveform analysis flowchart for Effect 3
Failure cases
Before and during the analysis, check for failure cases (F01–F05).
- Effects designated with F01 and F02 can't be processed by MATLAB code.
- Effects designated with F03-1 aren't eligible to be added to the performance map, even if they're processed by MATLAB code with no errors.
- Effects designated with F03-2, F04, and F05 can still be added to the performance map, despite failing processing.
- If
Vibrator.hasAmplitudeControl()returnsfalse, the DUT is designated as either F04 or F05. - If there's a noticeable delay (more than 500 ms) after clicking the Effect 3 button during the measurement, the DUT earns an F04 designation.
| Failure code | Description of failure | Applicable effects | Reason for failure | Fix for failure |
|---|---|---|---|---|
| F01 | No output signal is recorded. | Effect 1 | Haptic feedback constant isn't implemented. | Implement the empty constant as described in Implement constants. |
| F02 | MATLAB code error. The example for the MATLAB error is: Index exceeds matrix dimensions. |
Effect 1, Effect 2 | The amplitude of the haptic effect is too weak. | Increase the amplitude of the haptic effect. |
| F03-1, F03-2 | [F03-1] No MATLAB error, but PRR populated from the MATLAB code is smaller
than 0. [F03-2] No MATLAB error, but amplitude populated from the MATLAB code is smaller than 0.1 g. |
Effect 1, Effect 2 | The amplitude of the haptic effect is too weak. | Increase the amplitude of the haptic effect. |
| F04 | Signal is is too short (around 500 ms rather than 1000 ms). | Effect 3 | The device fails to generate scaled amplitude properly. The first 500 ms phase amplitude is generated with 0% amplitude even though 50% amplitude was called for. | Enable amplitude scale capabilities. |
| F05 | The two max amplitude values have little or no difference. | Effect 3 | The device fails to generate scaled amplitude properly. | Enable amplitude scale capabilities. |
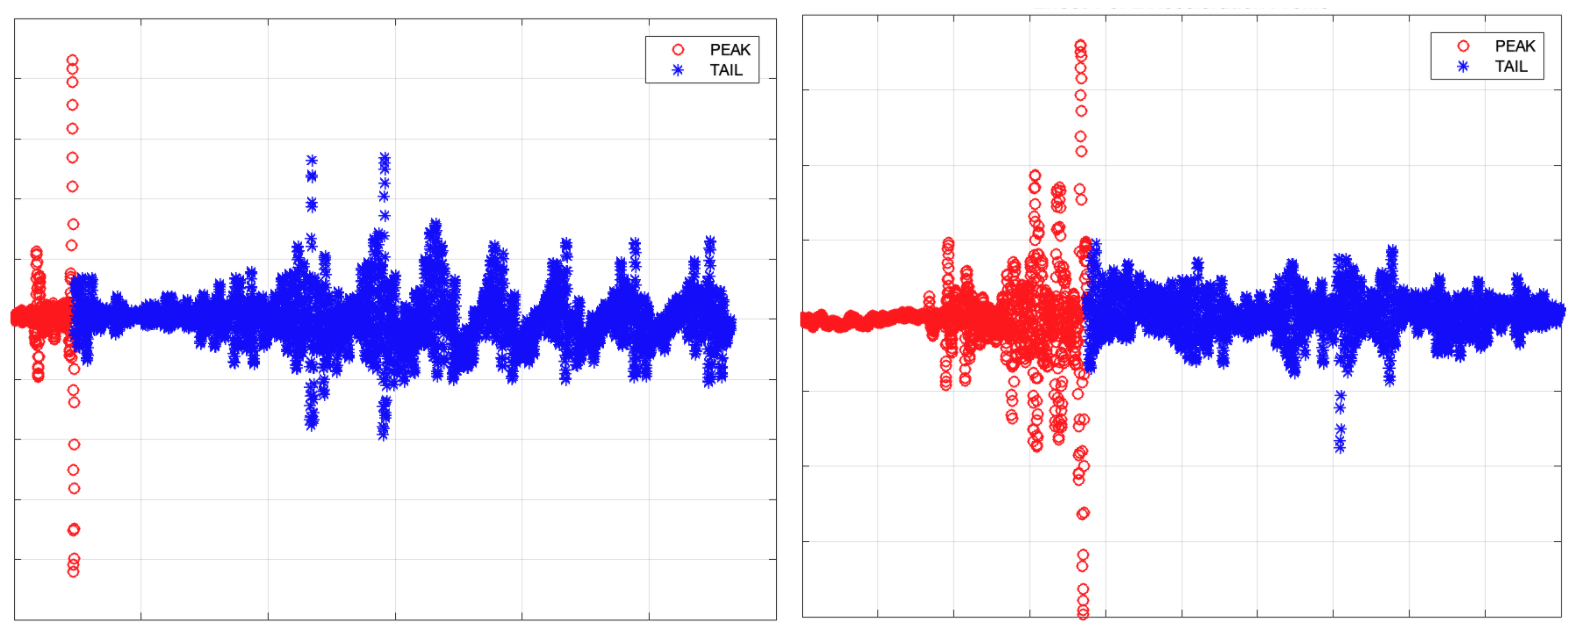
Figure 3. MATLAB signal plot examples for F03-1 (left) and F03-2 (right)
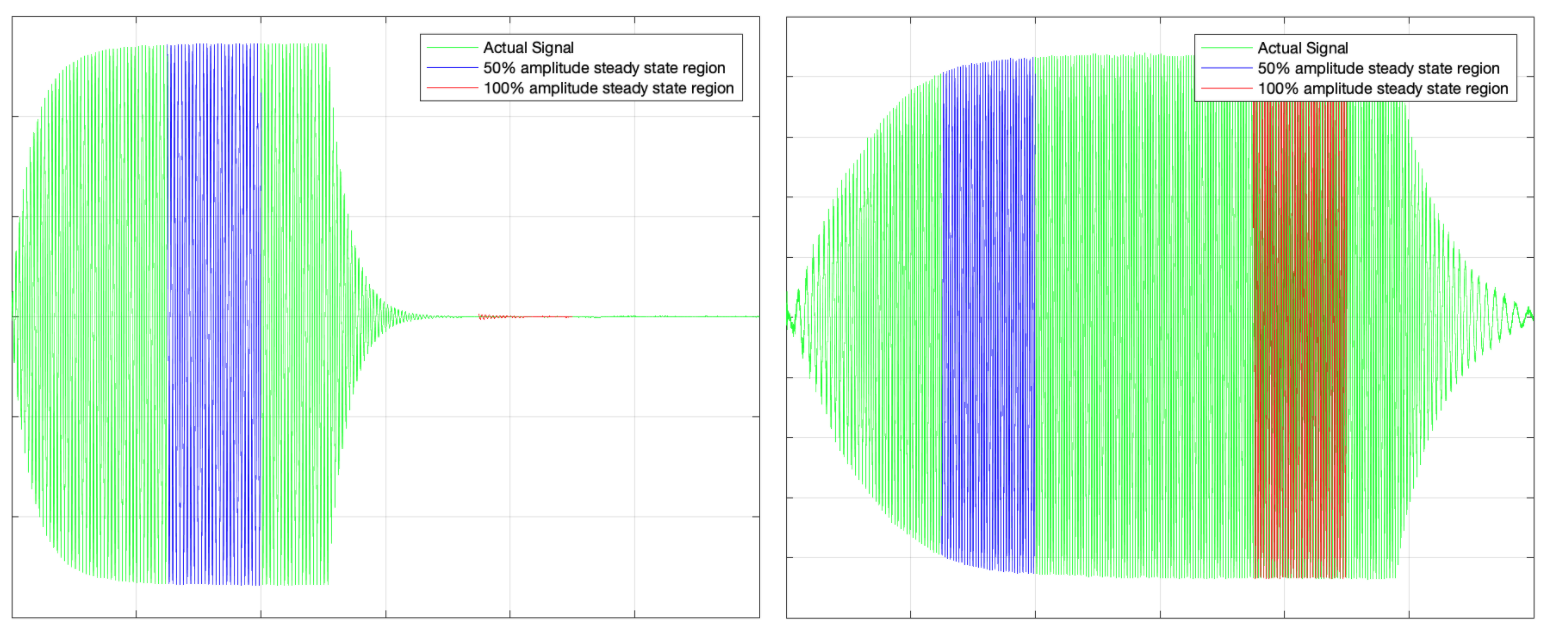
Figure 4. MATLAB signal plot examples for F04 (left) and F05 (right)
Acquire data from the analysis
When running MATLAB code for each effect, you can read the results displayed in the Command Window of the MATLAB software.
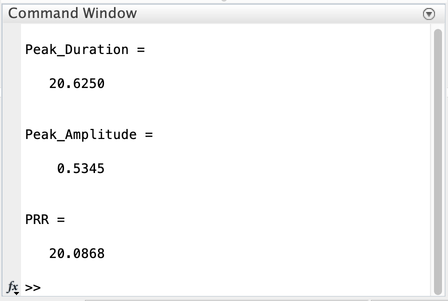
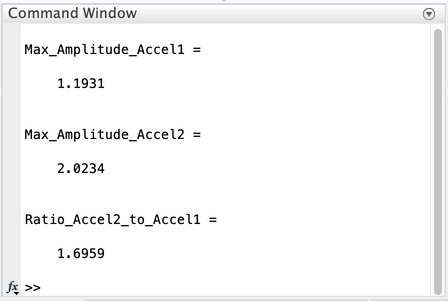
Figure 5. MATLAB results example in Command Window, Effect 1 (first) and Effect 3 (second)
Effect 1 and Effect 2 (short impulse)
- Peak duration (ms)
- Peak amplitude (g)
- PRR to calculate figure of metrics for sharpness (FOMS = PRR/peak duration)
Effect 3 (long vibration)
- Maximum amplitude (g) for two phases
Comparing results using the performance map includes the same set of data acquired from the representative devices in the Android ecosystem, so that you can populate the performance map accordingly. This helps you understand the whole ecosystem and align your data with the performance map data for comparison.
Use the following table to get an idea of how your DUT compares to other phones or tablets in the Android ecosystem. A specific question structured around that notion looks like this: Compared to other Android phones with similar characteristics (like price tier), is my phone performing better or worse than other phones?
| [Input] Effects to analyze |
[Output] Peak/maximum amplitude (G) |
[Output] Peak duration (ms) | [Output] Pulse-to-ring ratio (PRR) |
|---|---|---|---|
Effect 1: Predefined haptic constants
(VibrationEffect.EFFECT_CLICK) |
[1] Data 1-1 | [2] Data 1-2 | [3] Data 1-3 |
| Effect 2: Short custom haptic effect (duration = 20 ms, amplitude = 100%) | [4] Data 2-1 | [5] Data 2-2 | [6] Data 2-3 |
| Effect 3-1: Long custom haptic effect Acceleration phase 1 with 50% amplitude for the first 500 ms | [7] Data 3-1 | n/a | n/a |
| Effect 3-2: Long custom haptic effect Acceleration phase 2 with 100% amplitude for the second 500 ms | [8] Data 3-2 | n/a | n/a |
Pulse to ring ratio and peak amplitude for Effect 1 and Effect 2
Two key parameters measured in Effect 1 and Effect 2 are pulse to ring ratio (PRR) and peak amplitude. These parameters are based on the acceleration measurement made by the accelerometer setup.
PRR is calculated by taking the ratio of main pulse to ringing amplitude. Duration is the elapsed time for the main pulse. The formula for PRR is:

Figure 6. Simulated accel signal
These elements are illustrated in Figure 6:
- Main pulse: Defined by the signal inside the duration window where the amplitude decreases to 10% of peak amplitude.
Ring time: Defined by the signal where the amplitude decreases from 10% peak amplitude to less than 1% of the peak amplitude.
Calculate the PRR and duration: Create a curve fit that uses peak points of each acceleration period. Curve fitting is the best method to do this as it improves test repeatability by minimizing noise effects.
Maximum amplitude for Effect 3
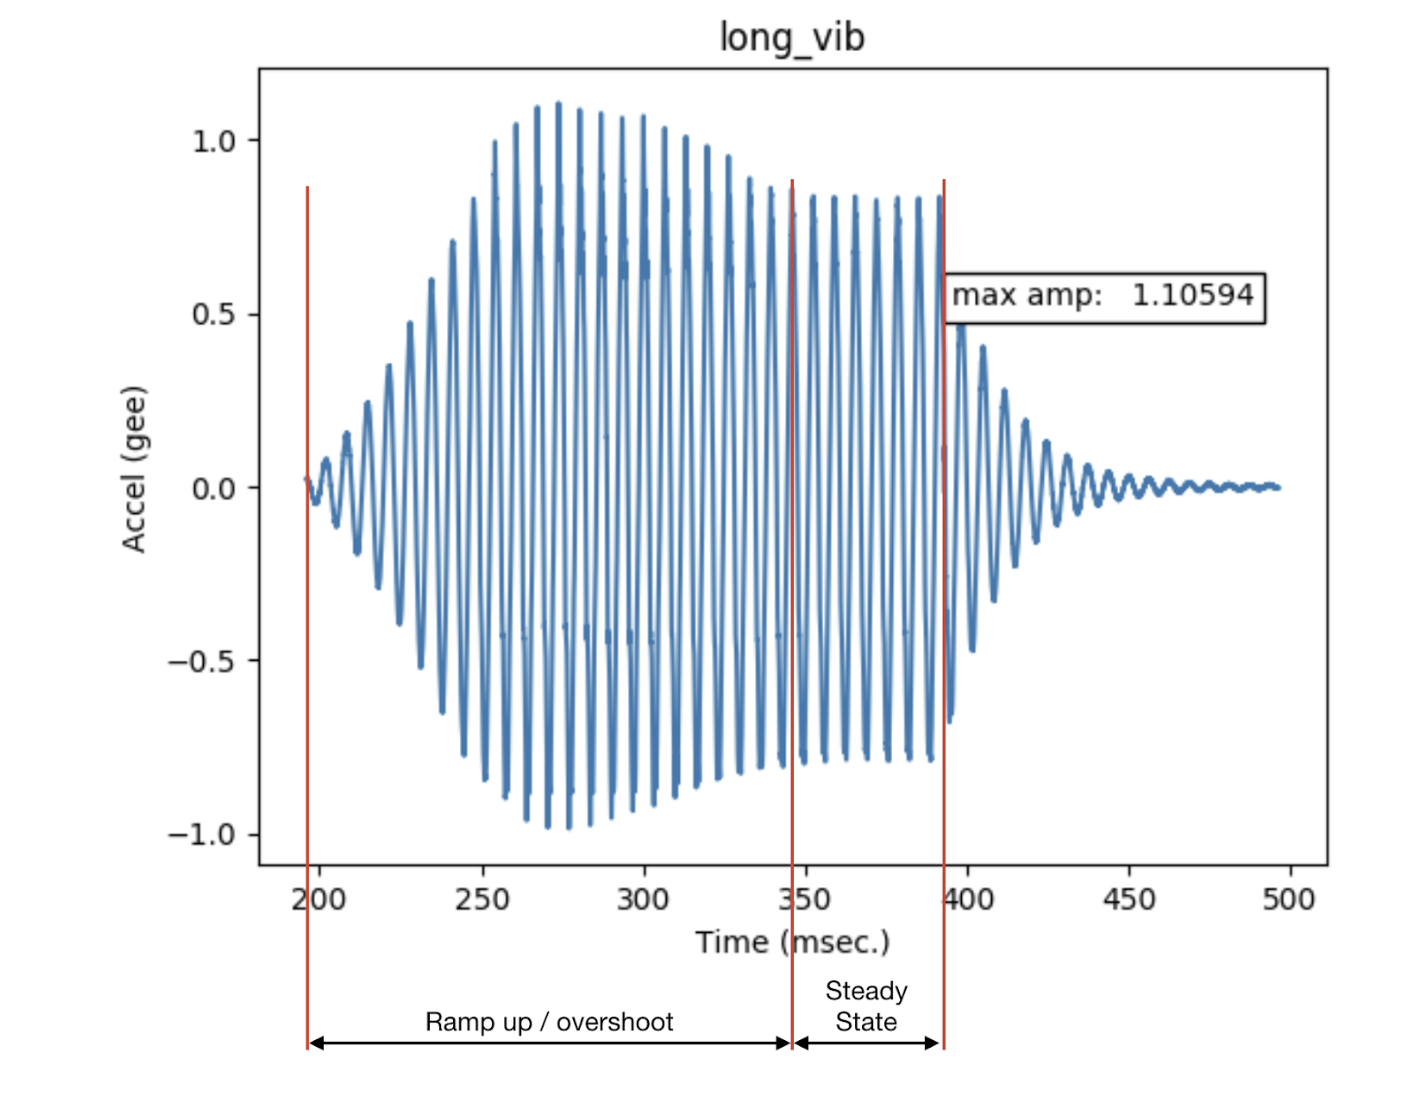
Figure 7. Actuator overshoot
These elements are illustrated in Figure 7:
- Long vibration
- The output from the linear resonant actuator when a sinusoidal input is applied, at the resonant frequency.
- Maximum amplitude
- The maximum amplitude of the long vibration, when the device vibration is at a steady state.
- Overshoot
- Overshoot occurs when the actuator is driven away from its resonance. The figure shows the type of behavior that occurs when the vibrator is driven away from the resonance with a sinusoidal input. This is an example of extreme overshoot.
- Minimal or no overshoot can be observed when the LRA is driven at its resonant frequency. Typical resonant frequencies of the LRA are between 50 and 250 Hz.
