
Given the difficulty of measuring input or output latency in isolation with custom hardware, audio latency is measured as round-trip latency, which represents the combined input and output latency.
Technique
The following steps are automated by the test software:
- The software generates a complex tone using short bursts of white noise of varying lengths, creating an easily recognizable structure.
- The device's audio output path plays the tone.
- The test loops back the audio output to an audio input.
- For speaker and microphone paths, no additional hardware is needed as the built-in microphone records the sound played from the built-in speaker.
- Analog 3.5 mm jacks use a custom Audio loopback dongle.
- USB ports use either a USB to 3.5 mm adapter combined with the loopback dongle or a USB audio interface with cables connecting the output to the input.
- The test software records the looped-back audio.
- The test software employs a full-duplex stream to synchronize and simultaneously record both the output and input audio streams.
The following figure shows the test setup:
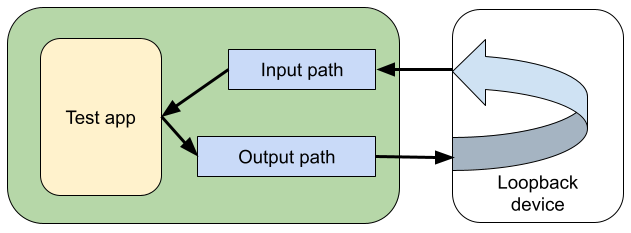
Figure 1. Measure audio latency.
Round-trip latency is determined by measuring the time offset between the output and input, using a normalized correlation algorithm to locate the output tone within the input stream.
The following figure shows how the round-trip latency is calculated:
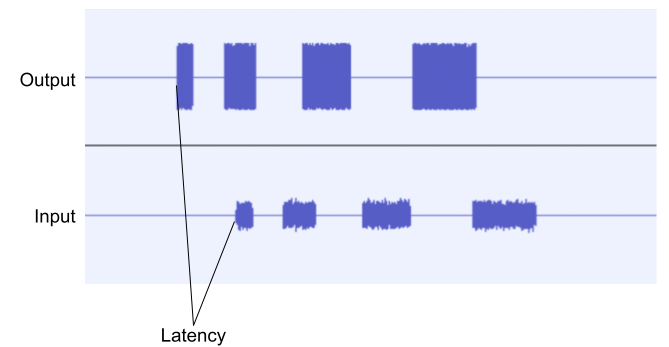
Figure 2. Calculate round-trip latency.
See CTS Verifier audio peripherals for more information about the loopback hardware.
Test apps
This section describes two main apps for measuring latency. Both use identical techniques and are expected to yield comparable results.
OboeTester
OboeTester, a test suite designed for the Oboe library, offers valuable tests, including round-trip latency measurement.
You can get OboeTester in one of two ways:
- Build the app from source, which can be found on GitHub.
- Install the app from Google Play Store.
Follow these steps to measure the latency on the OboeTester app:
- Launch OboeTester.
- Tap ROUND TRIP LATENCY.
- Tap MEASURE.
- Check the
latency.msecvalue for the round-trip latency.
You can run this test using an Intent for Continuous Integration.
CTS Verifier
See the CTS Verifier Audio loopback latency test to determine if round-trip latency meets CDD requirements.