Run Winscope locally or access it from a web server.
You can capture traces using Winscope for local development and debugging. Winscope uses adb, which supports device connection over USB or Wi-Fi.
When you launch Winscope, the Collect Traces screen appears.
Device connection
You can connect devices in Winscope using Winscope Proxy or Web Device Proxy. By default, the Winscope homepage shows the Winscope Proxy connection setup UI.
To start capturing traces, choose one of the following device connection mechanisms.
Winscope Proxy setup
Follow these steps to set up Winscope Proxy:
On the Collect Traces section of the homepage, select Winscope Proxy from the Select connection type menu:
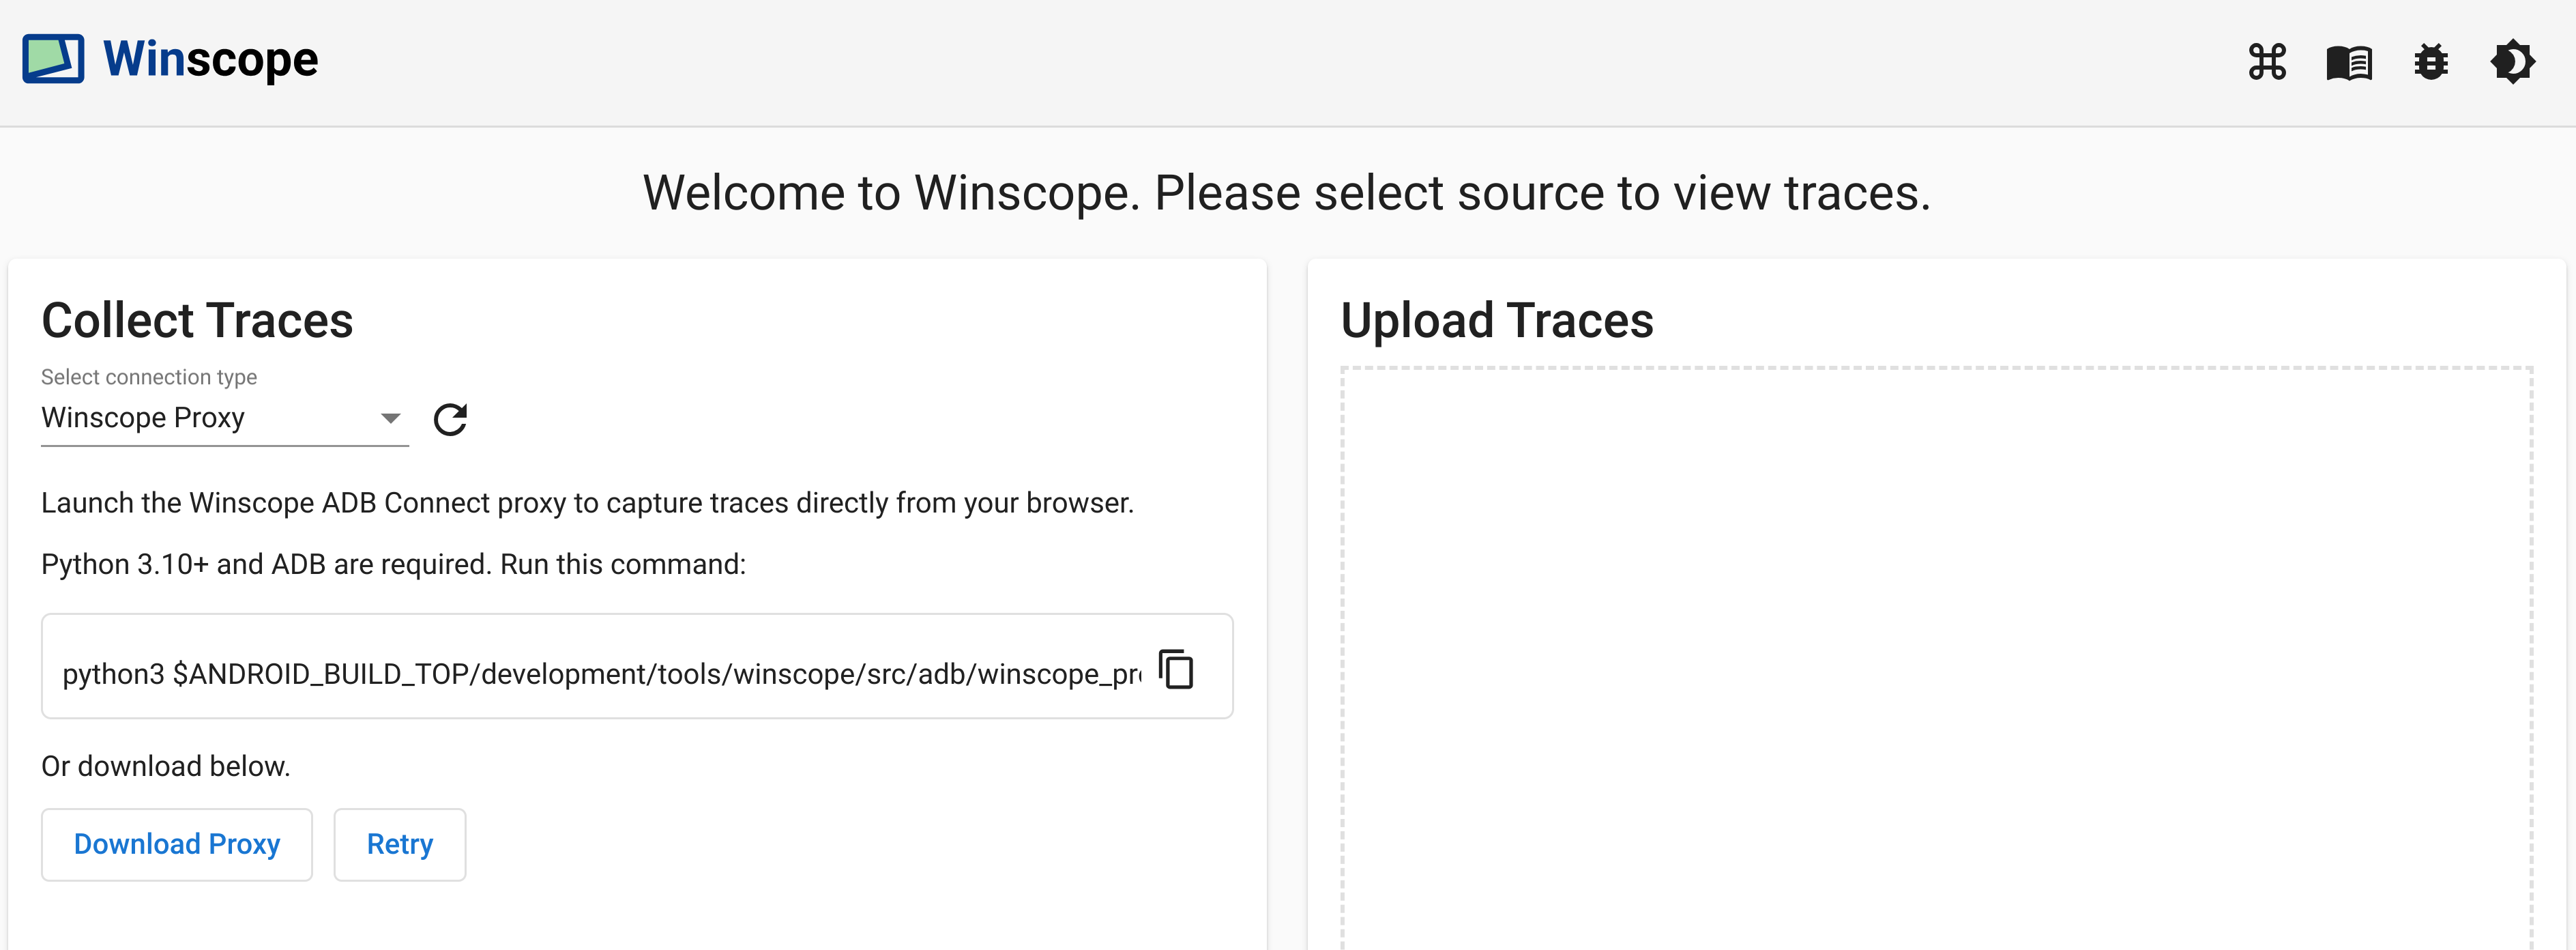
Figure 1. Capture traces using Winscope Proxy.
Launch the Winscope ADB Connect proxy to capture traces directly from your browser, by running the following command:
python3 $ANDROID_BUILD_TOP/development/tools/winscope/src/adb/winscope_proxy.pyNote the Winscope proxy token displayed on the terminal after execution.
After you launch the Winscope ADB Connect proxy, the screen changes as follows. To establish the initial connection to the proxy, input the Winscope proxy token from step 3 and click Connect.
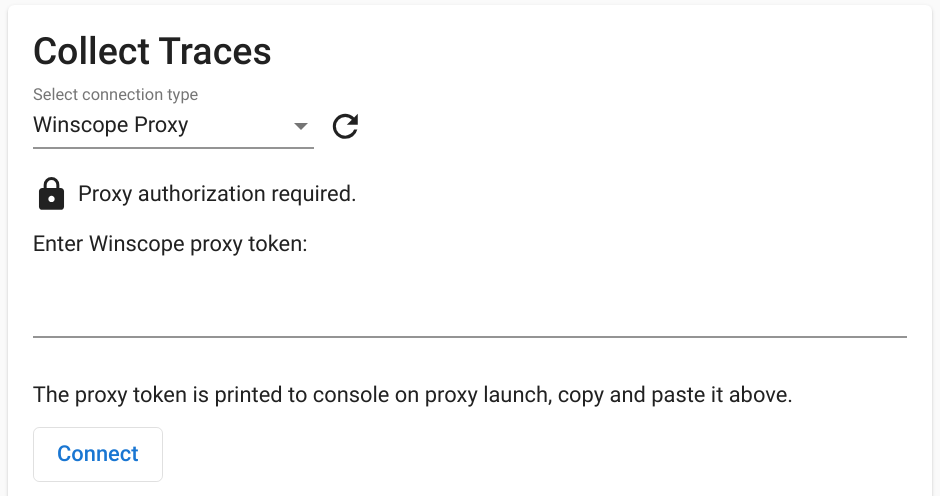
Figure 2. Connect to Winscope Proxy.
Web Device Proxy setup
Follow these steps to set up Web Device Proxy:
On the Collect Traces section of the homepage, select Web Device Proxy from the Select connection type menu:

Figure 3. Capture traces using Web Device Proxy.
If you don't have the Web Device Proxy daemon on your machine, click Install or run the installer.
Approve origin access to Web Device Proxy through the dialog.
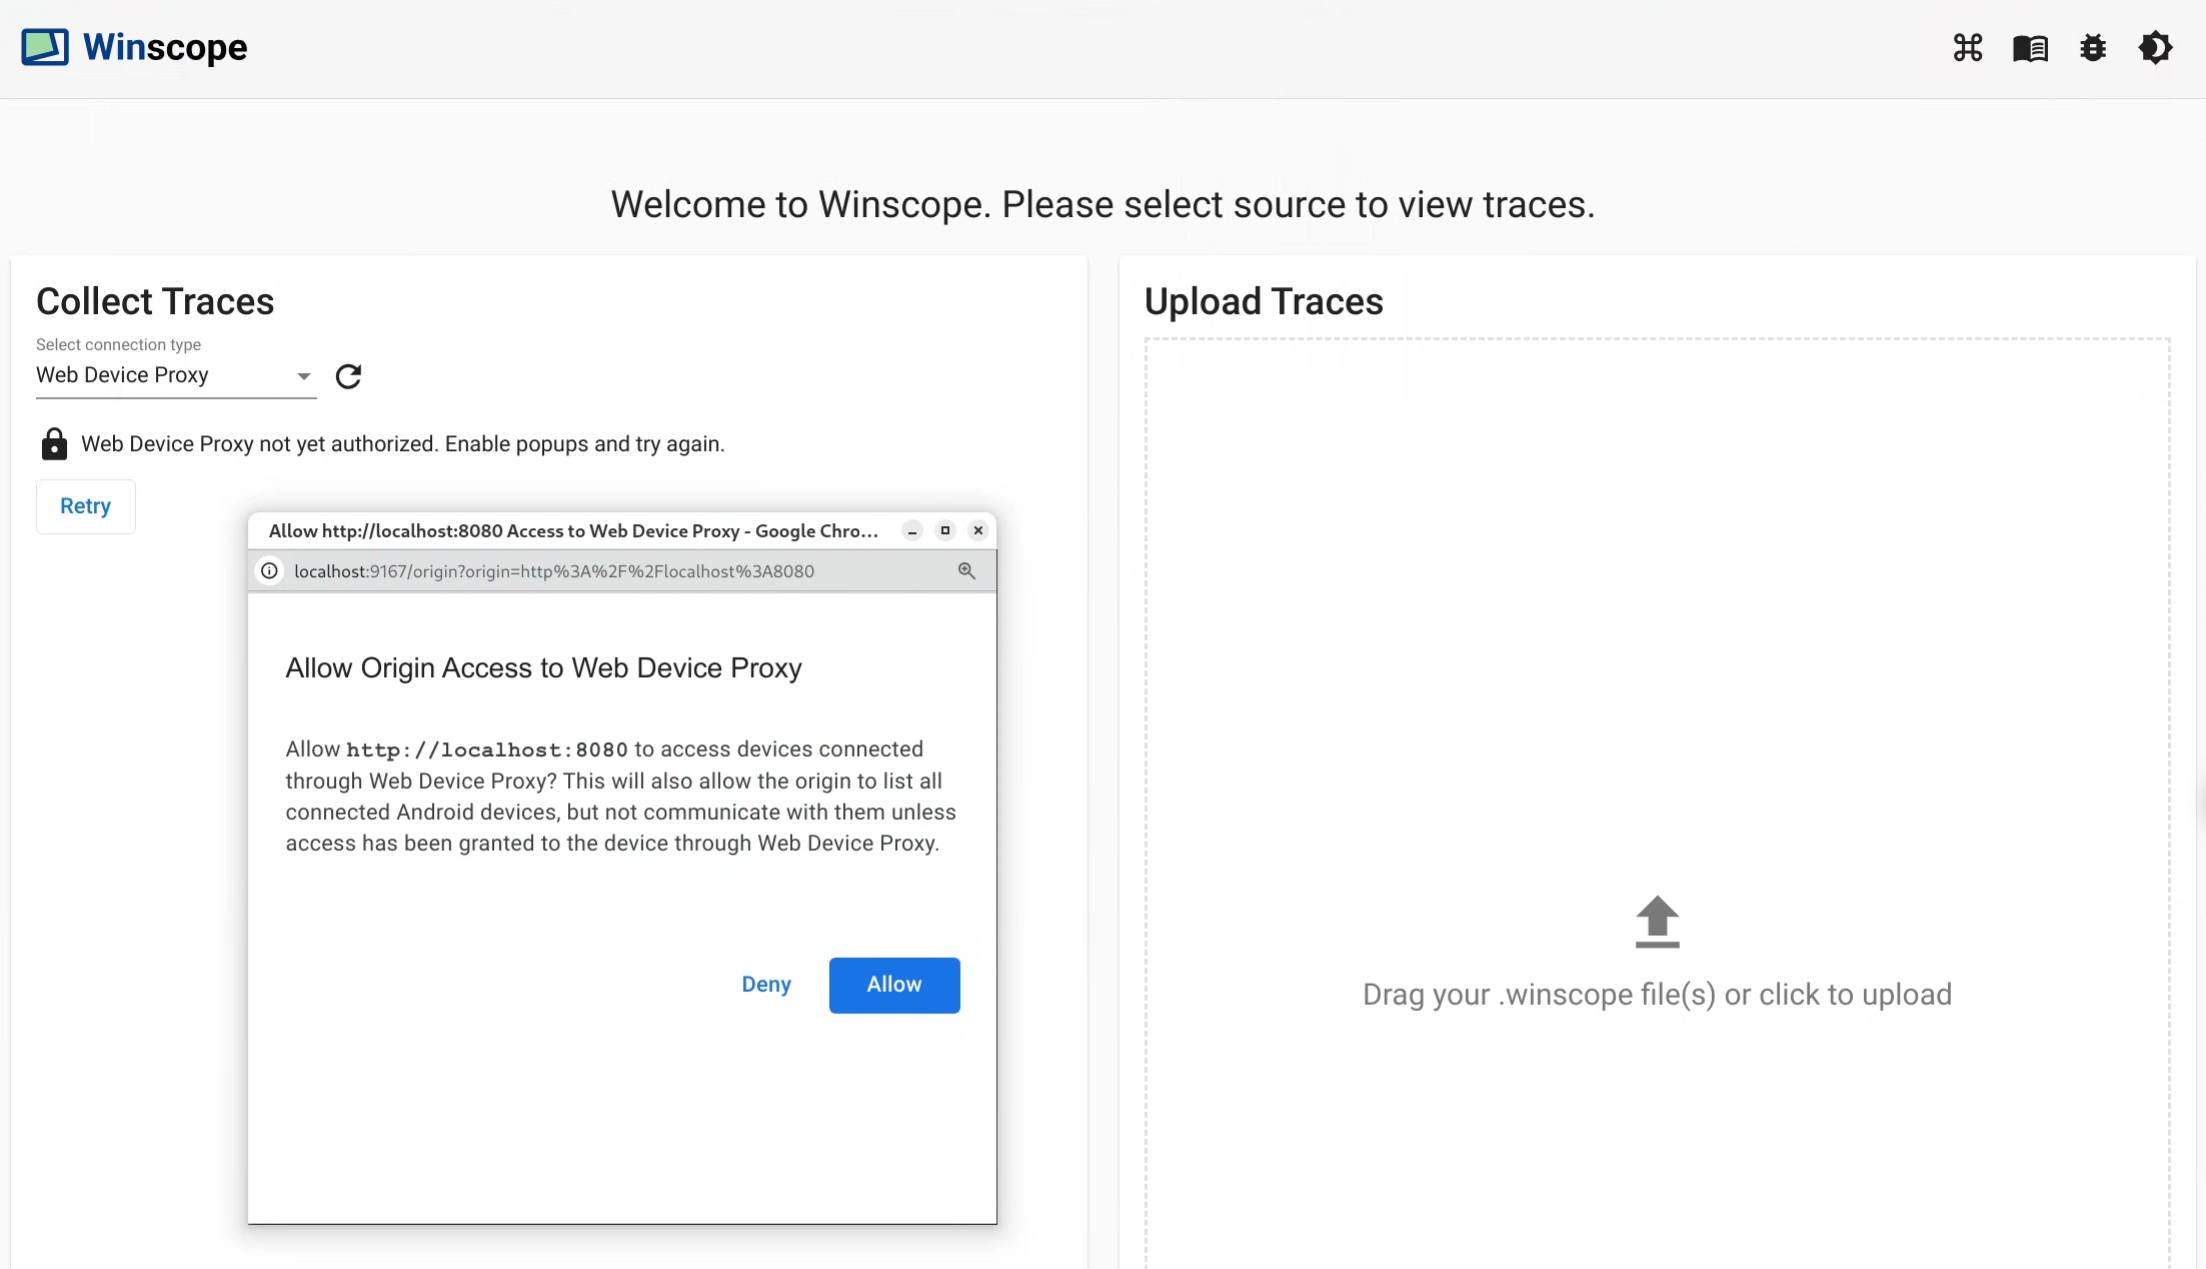
Figure 4. Authorize origin.
Approve access for each new device the first time you connect to the device. If the dialog does not automatically appear, click the
lock_openicon next to the device:
Figure 5. Authorize device.
Traces
Follow these steps to collect traces:
When connected, to initiate the capture process, select the targets and configure the settings. Then click Start trace to begin the capture:
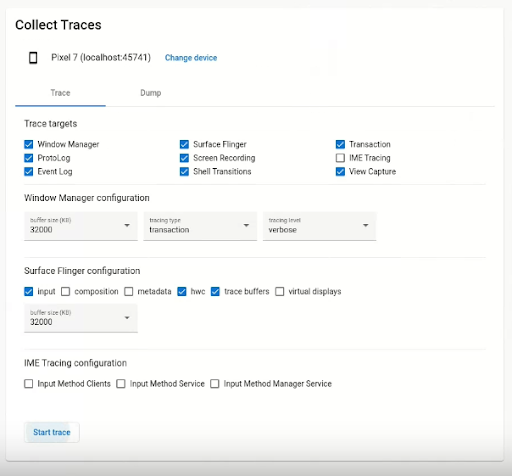
Figure 6. Collect traces in Winscope.
To stop the capture, click End trace:
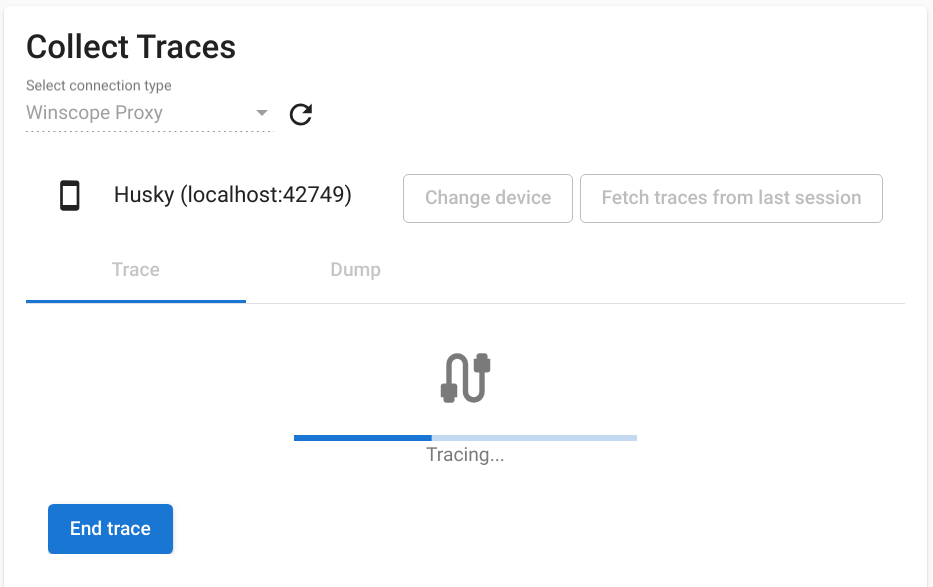
Figure 7. End trace in Winscope.
Trace options
This section describes the options for each trace type.
Screen recording
With Winscope, you can record the screen of multiple displays. Choose a display from the menu to screen record. If you don't make a selection, Winscope records the active display by default.
SurfaceFlinger
Buffer size: Adjusts the size of the in-memory ring buffer for the SurfaceFlinger trace. A larger buffer enables the collection of more data but increases memory usage.
Input: If the surface contains input data, tracks the specifics of the input window.
Composition: Traces the composition type and visible region.
Metadata: Traces additional surface metadata, including offscreen layers.
HWC: Traces additional unstructured hardware composer metadata.
Trace buffers: Configures SurfaceFlinger to trace all buffer changes on the surface. By default, SurfaceFlinger traces a new state only when the geometry is altered.
Virtual displays: Includes virtual display layers in the trace.
WindowManager
- Buffer size: Adjusts the size of the in-memory ring buffer for the WindowManager trace. A larger buffer enables the collection of more data but increases memory usage.
Tracing type: Defines the frequency options for collecting states:
- frame: In this mode, the WindowManager dumps a single state per frame, ensuring that only valid WindowManager states are captured. This mode has the lowest performance overhead.
- transaction: This mode records a WindowManager state whenever a transaction is committed. You can commit multiple transactions within a frame, so this allows for debugging intermediate WindowManager states during a frame. However, this mode has a higher performance overhead compared to the frame mode.
Tracing level: Determines the verbosity of the WindowManager traces:
- verbose: Includes all windows and configuration information for each window. This mode has the highest memory and performance overhead.
- debug: Includes information about all windows, but logs only the window configuration if it contains a requested override configuration.
- critical: Includes the same information as Debug mode, but includes only visible windows. This mode has the smallest memory and performance overhead.
Dumps
To take a state dump using Winscope, under Collect Traces on the homepage select the Dump tab and then click Dump state:
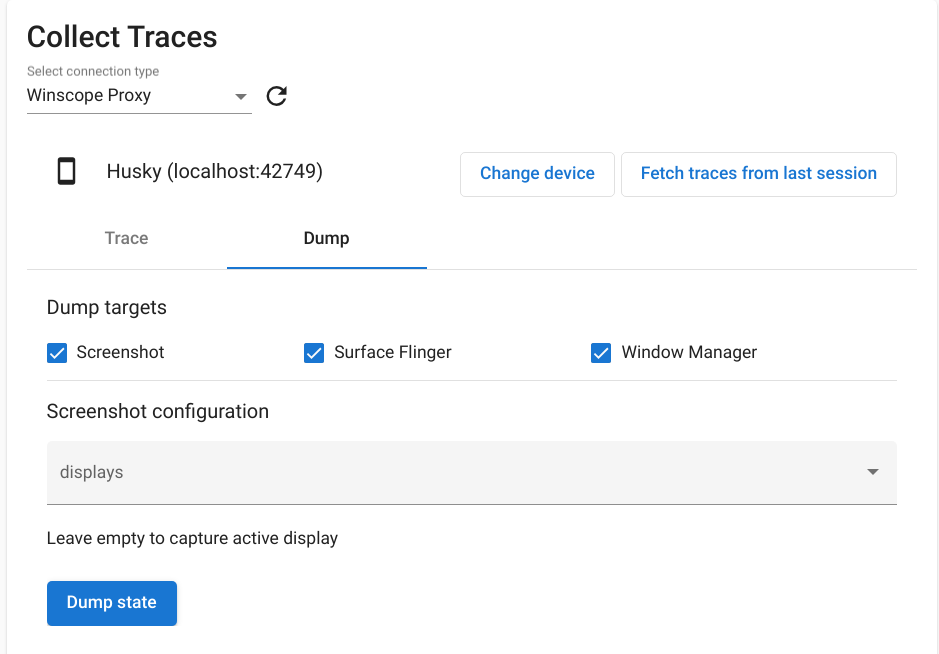
Figure 8. Dump state in Winscope.
Screenshot configuration
Winscope allows taking a screenshot for multiple displays. Choose a display from the menu to screenshot. If no selection is made, a screenshot is collected for the active display.
