Winscope is a web tool that lets you record, replay, and analyze the states of several system services during and after animations and transitions. Winscope records all pertinent system service states to a trace file. Using the Winscope UI with the trace file, you can inspect the state of these services for each animation frame, with or without a screen recording, by replaying, stepping through, and debugging the transitions.
Supported traces
Winscope provides the ability to gather and visually represent various traces, that is, sequences of system service states. You can configure these traces to suit specific use cases, ranging from low overhead to high verbosity. Winscope supports the following traces:
- EventLog: Collect the system diagnostic event record using
EventLog. In Winscope this information is used only to identify and display CUJ markings. - IME: Trace events from the Input Method Editor (IME) pipeline, including IMS, IMMS, and IME Client.
- Input: Trace input events from various parts of the input event pipeline.
- ProtoLog: Collect ProtoLog messages from system services and the code of system services running in client processes.
- Screen recording: Collect a screen recording alongside the traces.
- Shell transitions: Record window and activity transition system details.
- SurfaceFlinger: Collect SurfaceFlinger traces containing information about surfaces (layers) such as position, buffer, and composition.
- Transactions: Trace the set of atomic changes received by SurfaceFlinger
using
SurfaceControlfor composition. - ViewCapture: Capture a range of properties of all the views from system Windows that support ViewCapture, like System UI and Launcher.
- Window Manager: Trace Window Manager states containing details pertaining to windows, including input and focus events, screen orientation, transitions, animations, positioning, and transformations.
Supported dumps
Winscope can collect and display state dumps, which are snapshots of the device's state taken at specific moments defined by you. Unlike traces, which are continuously collected during device usage and can affect performance, dumps are taken only at these user-defined moments, to verify that performance and verbosity are not compromised. This allows for a more focused and efficient analysis of the device's state at specific points in time. Winscope supports the following dumps:
- Window Manager: Dump a single Window Manager state.
- SurfaceFlinger: Dump a single SurfaceFlinger snapshot.
- Screenshot: Collect a screenshot alongside the dumps.
Resources
See Run Winscope for information about building and running Winscope.
See Capture traces for information about collecting traces.
See Load traces for information about how to load traces using the Winscope Web UI.
See Analyze traces for information about analyzing traces.
Examples
The following example describe how to debug a flicker test failure and a user reported bug.
Flicker test failure
This example demonstrates how to use Winscope to debug a flicker test failure.
Examine the test failure
Follow these steps to determine the issue type and examine the test failure message.
Determine the issue type by examining the test and class name.
Test and class name:
FlickerTestsNotification com.android.server.wm.flicker.notification.OpenAppFromLockscreenNotificationColdTest#appLayerBecomesVisible[ROTATION_0_GESTURAL_NAV]Issue type:
- The CUJ refers to launching an app from a lockscreen notification
(
OpenAppFromLockscreenNotificationColdTest). - The test expects the app to become visible (
#appLayerBecomesVisible).
- The CUJ refers to launching an app from a lockscreen notification
(
Examine the test failure message, which provides comprehensive information about the failure, including:
- A comparison between the expected outcome and the actual visible outcome
- Timestamps to help pinpoint when the failure occurred
- The name of the artifact or file associated with the failure
- Additional contextual information relevant to understanding and debugging the failure
android.tools.flicker.subject.exceptions.IncorrectVisibilityException: com.android.server.wm.flicker.testapp/com.android.server.wm.flicker.testapp.NotificationActivity# should be visible

Where?
    Timestamp(UNIX=2024-05-10T11:04:14.227572545(1715339054227572545ns), UPTIME=37m21s184ms79178ns(2241184079178ns), ELAPSED=0ns)

What?
    Expected: com.android.server.wm.flicker.testapp/com.android.server.wm.flicker.testapp.NotificationActivity#
    Actual: [e636ecd com.android.server.wm.flicker.testapp/com.android.server.wm.flicker.testapp.NotificationActivity#3457: Buffer is empty, Visible region calculated by Composition Engine is empty, com.android.server.wm.flicker.testapp/com.android.server.wm.flicker.testapp.NotificationActivity#3458: Visible region calculated by Composition Engine is empty]

Other information
    Artifact: FAIL__OpenAppFromLockscreenNotificationColdTest_ROTATION_0_GESTURAL_NAV.zip

Check the test run artifacts for trace files

    at android.tools.flicker.subject.layers.LayerTraceEntrySubject.isVisible(LayerTraceEntrySubject.kt:187)
    at android.tools.flicker.subject.layers.LayersTraceSubject$isVisible$1$1.invoke(LayersTraceSubject.kt:151)
    at android.tools.flicker.subject.layers.LayersTraceSubject$isVisible$1$1.invoke(LayersTraceSubject.kt:150)
    at android.tools.flicker.assertions.NamedAssertion.invoke(NamedAssertion.kt:32)
    at android.tools.flicker.assertions.CompoundAssertion.invoke(CompoundAssertion.kt:42)
    at android.tools.flicker.assertions.AssertionsChecker.test(AssertionsChecker.kt:79)
    at android.tools.flicker.subject.FlickerTraceSubject.forAllEntries(FlickerTraceSubject.kt:59)
    at android.tools.flicker.assertions.AssertionDataFactory$createTraceAssertion$closedAssertion$1.invoke(AssertionDataFactory.kt:46)
    at android.tools.flicker.assertions.AssertionDataFactory$createTraceAssertion$closedAssertion$1.invoke(AssertionDataFactory.kt:43)
    at android.tools.flicker.assertions.AssertionDataImpl.checkAssertion(AssertionDataImpl.kt:33)
    at android.tools.flicker.assertions.ReaderAssertionRunner.doRunAssertion(ReaderAssertionRunner.kt:35)
    at android.tools.flicker.assertions.ReaderAssertionRunner.runAssertion(ReaderAssertionRunner.kt:29)
    at android.tools.flicker.assertions.BaseAssertionRunner.runAssertion(BaseAssertionRunner.kt:36)
    at android.tools.flicker.legacy.LegacyFlickerTest.doProcess(LegacyFlickerTest.kt:59)
    at android.tools.flicker.assertions.BaseFlickerTest.assertLayers(BaseFlickerTest.kt:89)
    at com.android.server.wm.flicker.notification.OpenAppTransition.appLayerBecomesVisible_coldStart(OpenAppTransition.kt:51)
    at com.android.server.wm.flicker.notification.OpenAppFromNotificationColdTest.appLayerBecomesVisible(OpenAppFromNotificationColdTest.kt:64)
This output sample indicates the following:
- The issue happens at
2024-05-10T11:04:14.227572545. NotificationActivityis expected to be visible but it isn't.- The name of the artifact file that contains the traces for debugging
is
FAIL__OpenAppFromLockscreenNotificationColdTest_ROTATION_0_GESTURAL_NAV.
Debug
Follow these steps to determine the cause of the flicker:
Download the trace files and load them in Winscope. Winscope opens with SurfaceFlinger autoselected:
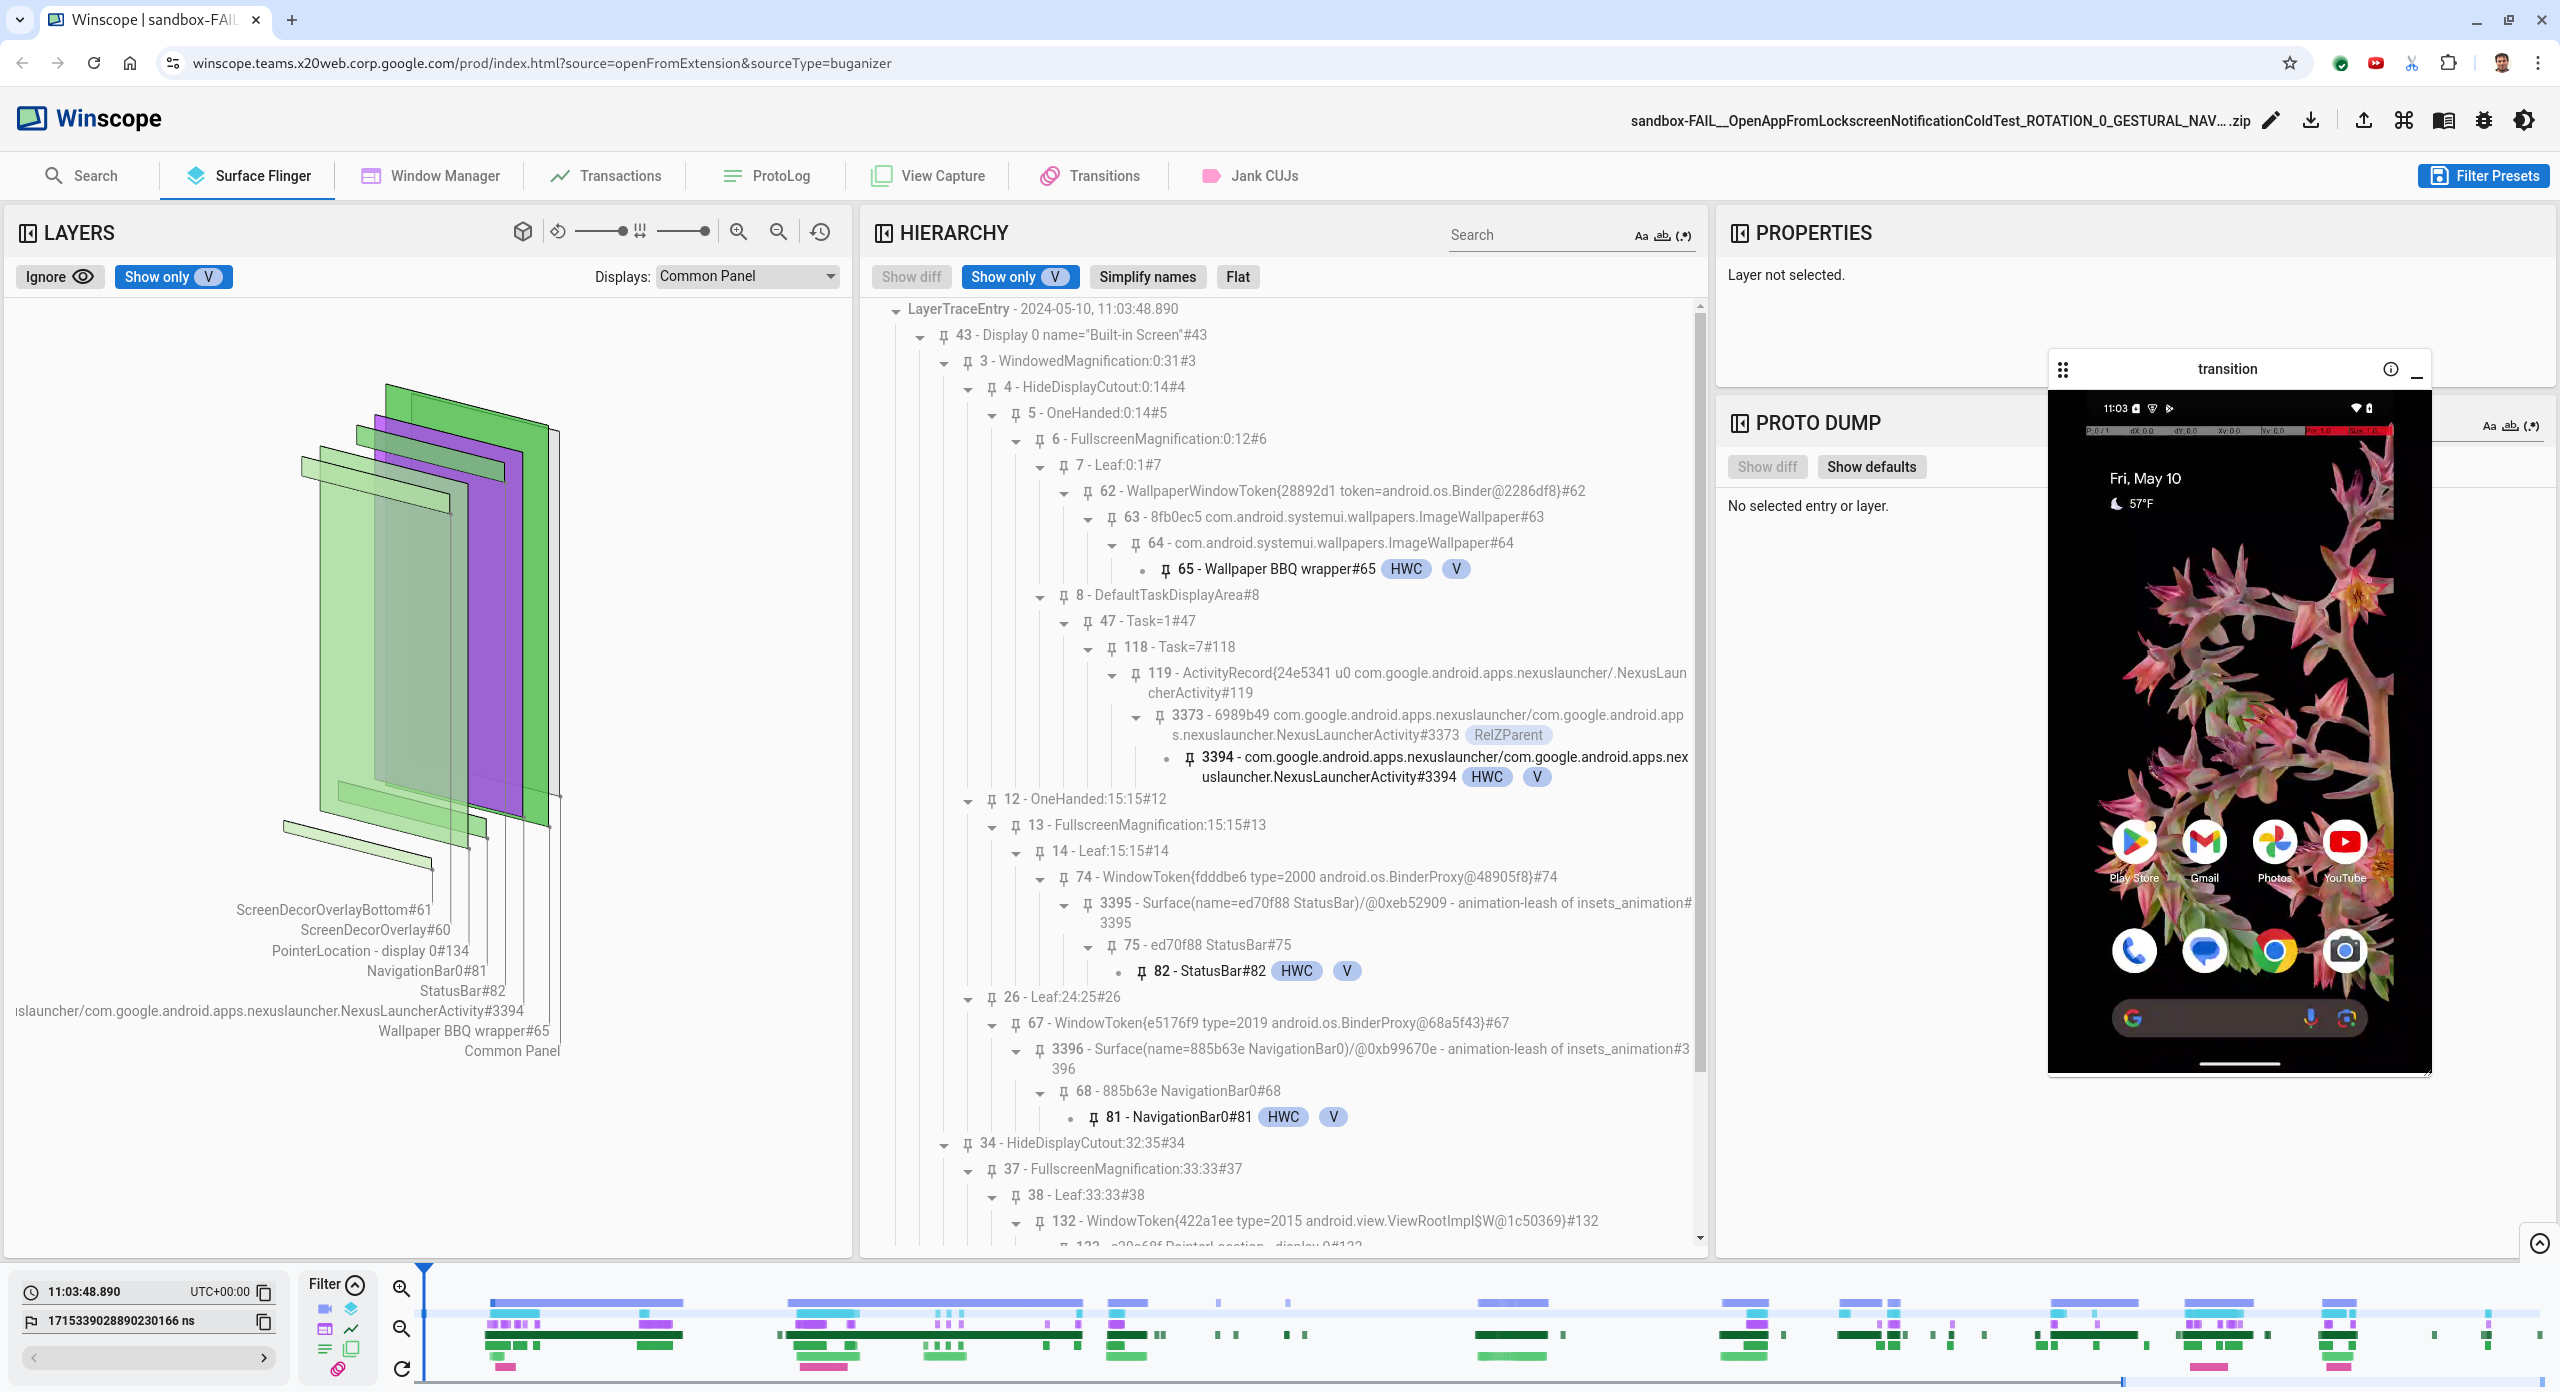
Figure 1. Winscope landing page with SurfaceFlinger view.
Navigate to the timestamp where the issue happens by copying and pasting the timestamp from the exception message into the timestamp field. You can either copy the timestamp in human-readable format (
2024-05-10T11:04:14.227572545) and paste into the first field, or copy the timestamp in nanoseconds (1715339054227572545ns) and paste into the second field.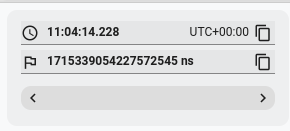
Figure 2. Timestamp dialog.
Press the left arrow key to navigate to the previous frame. In this state the NotificationActivity app shows correctly in the video, and both the app and splash screen surfaces are visible, indicated by their green rects in the 3D view, and the V chip on their hierarchy elements.
The app and splash screen surface names are:
com.android.server.wm.flicker.testapp/com.android.server.wm.flicker.testapp.NotificationActivity#3458`

Splash Screen com.android.server.wm.flicker.testapp#3453
This indicates that the app was launching when the screen became black and that this event is happening during the app launch, as the splash screen is still visible:
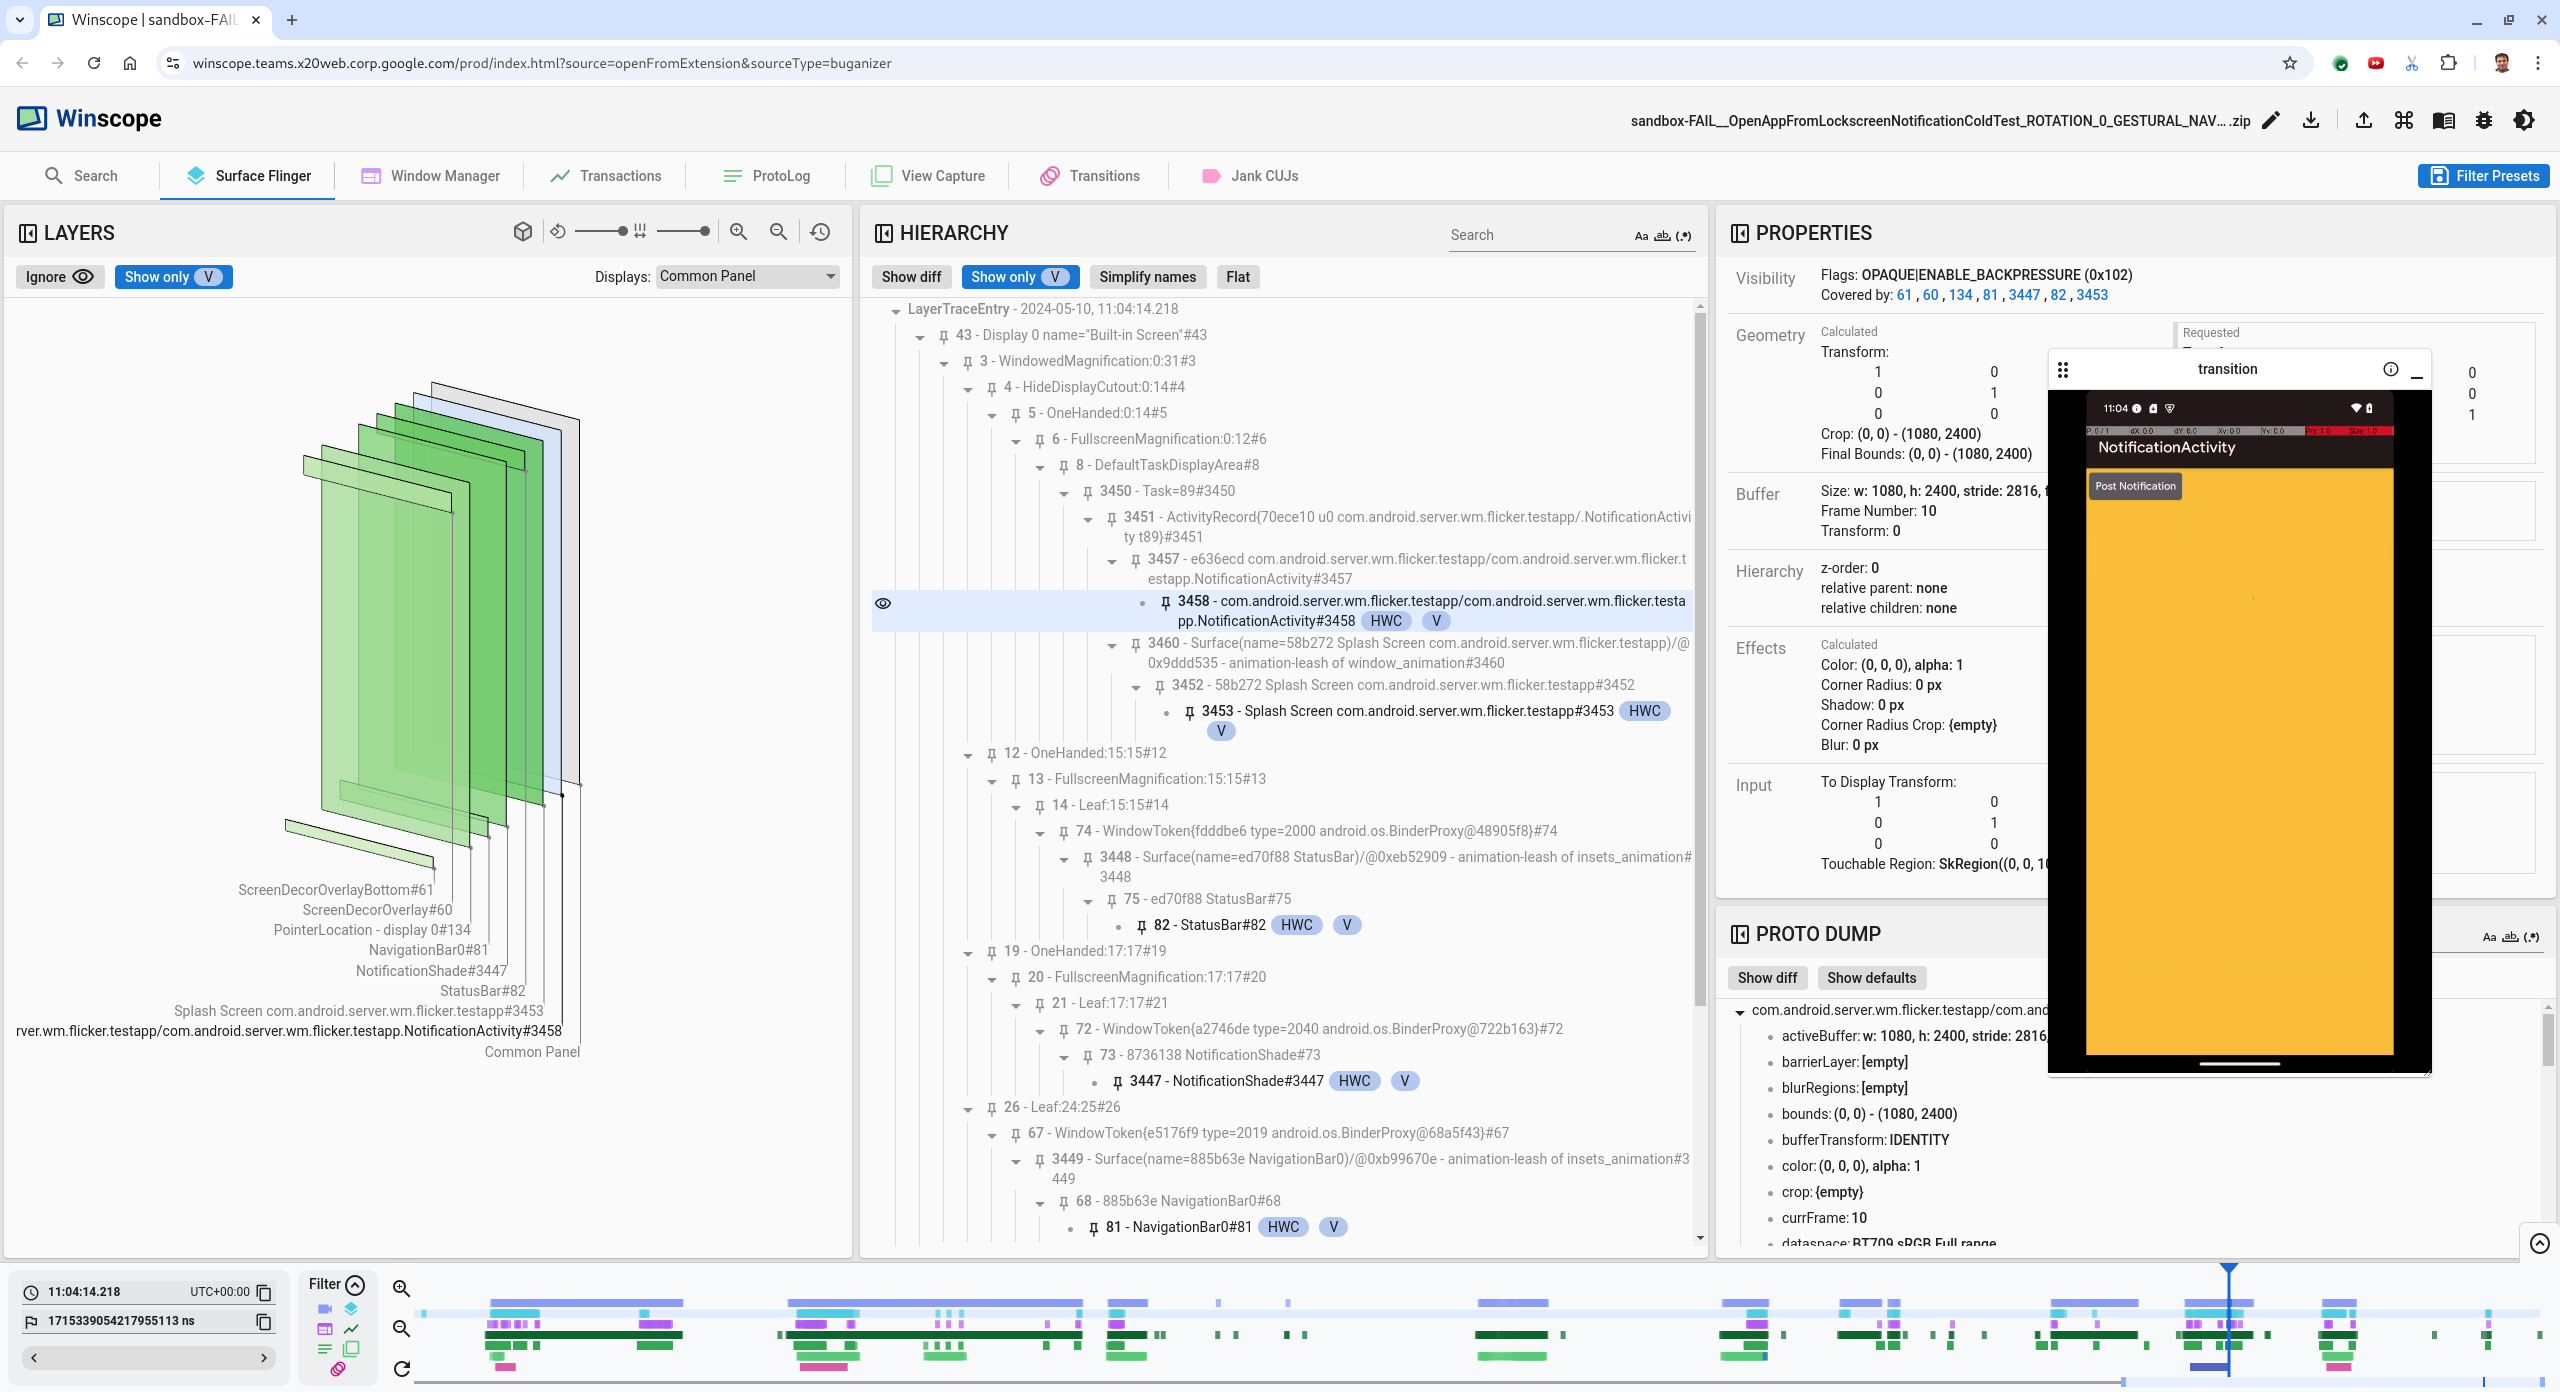
Figure 3. At app launch.
Press the right arrow key to navigate back to the next frame, where the flicker occurs. In the rects view the
NotificationShadeis shown on screen, instead of the app. The following surfaces are shown in this frame:- Screen decor overlays (top and bottom)
- Navigation bar
- Pointer location (from the screen recording)
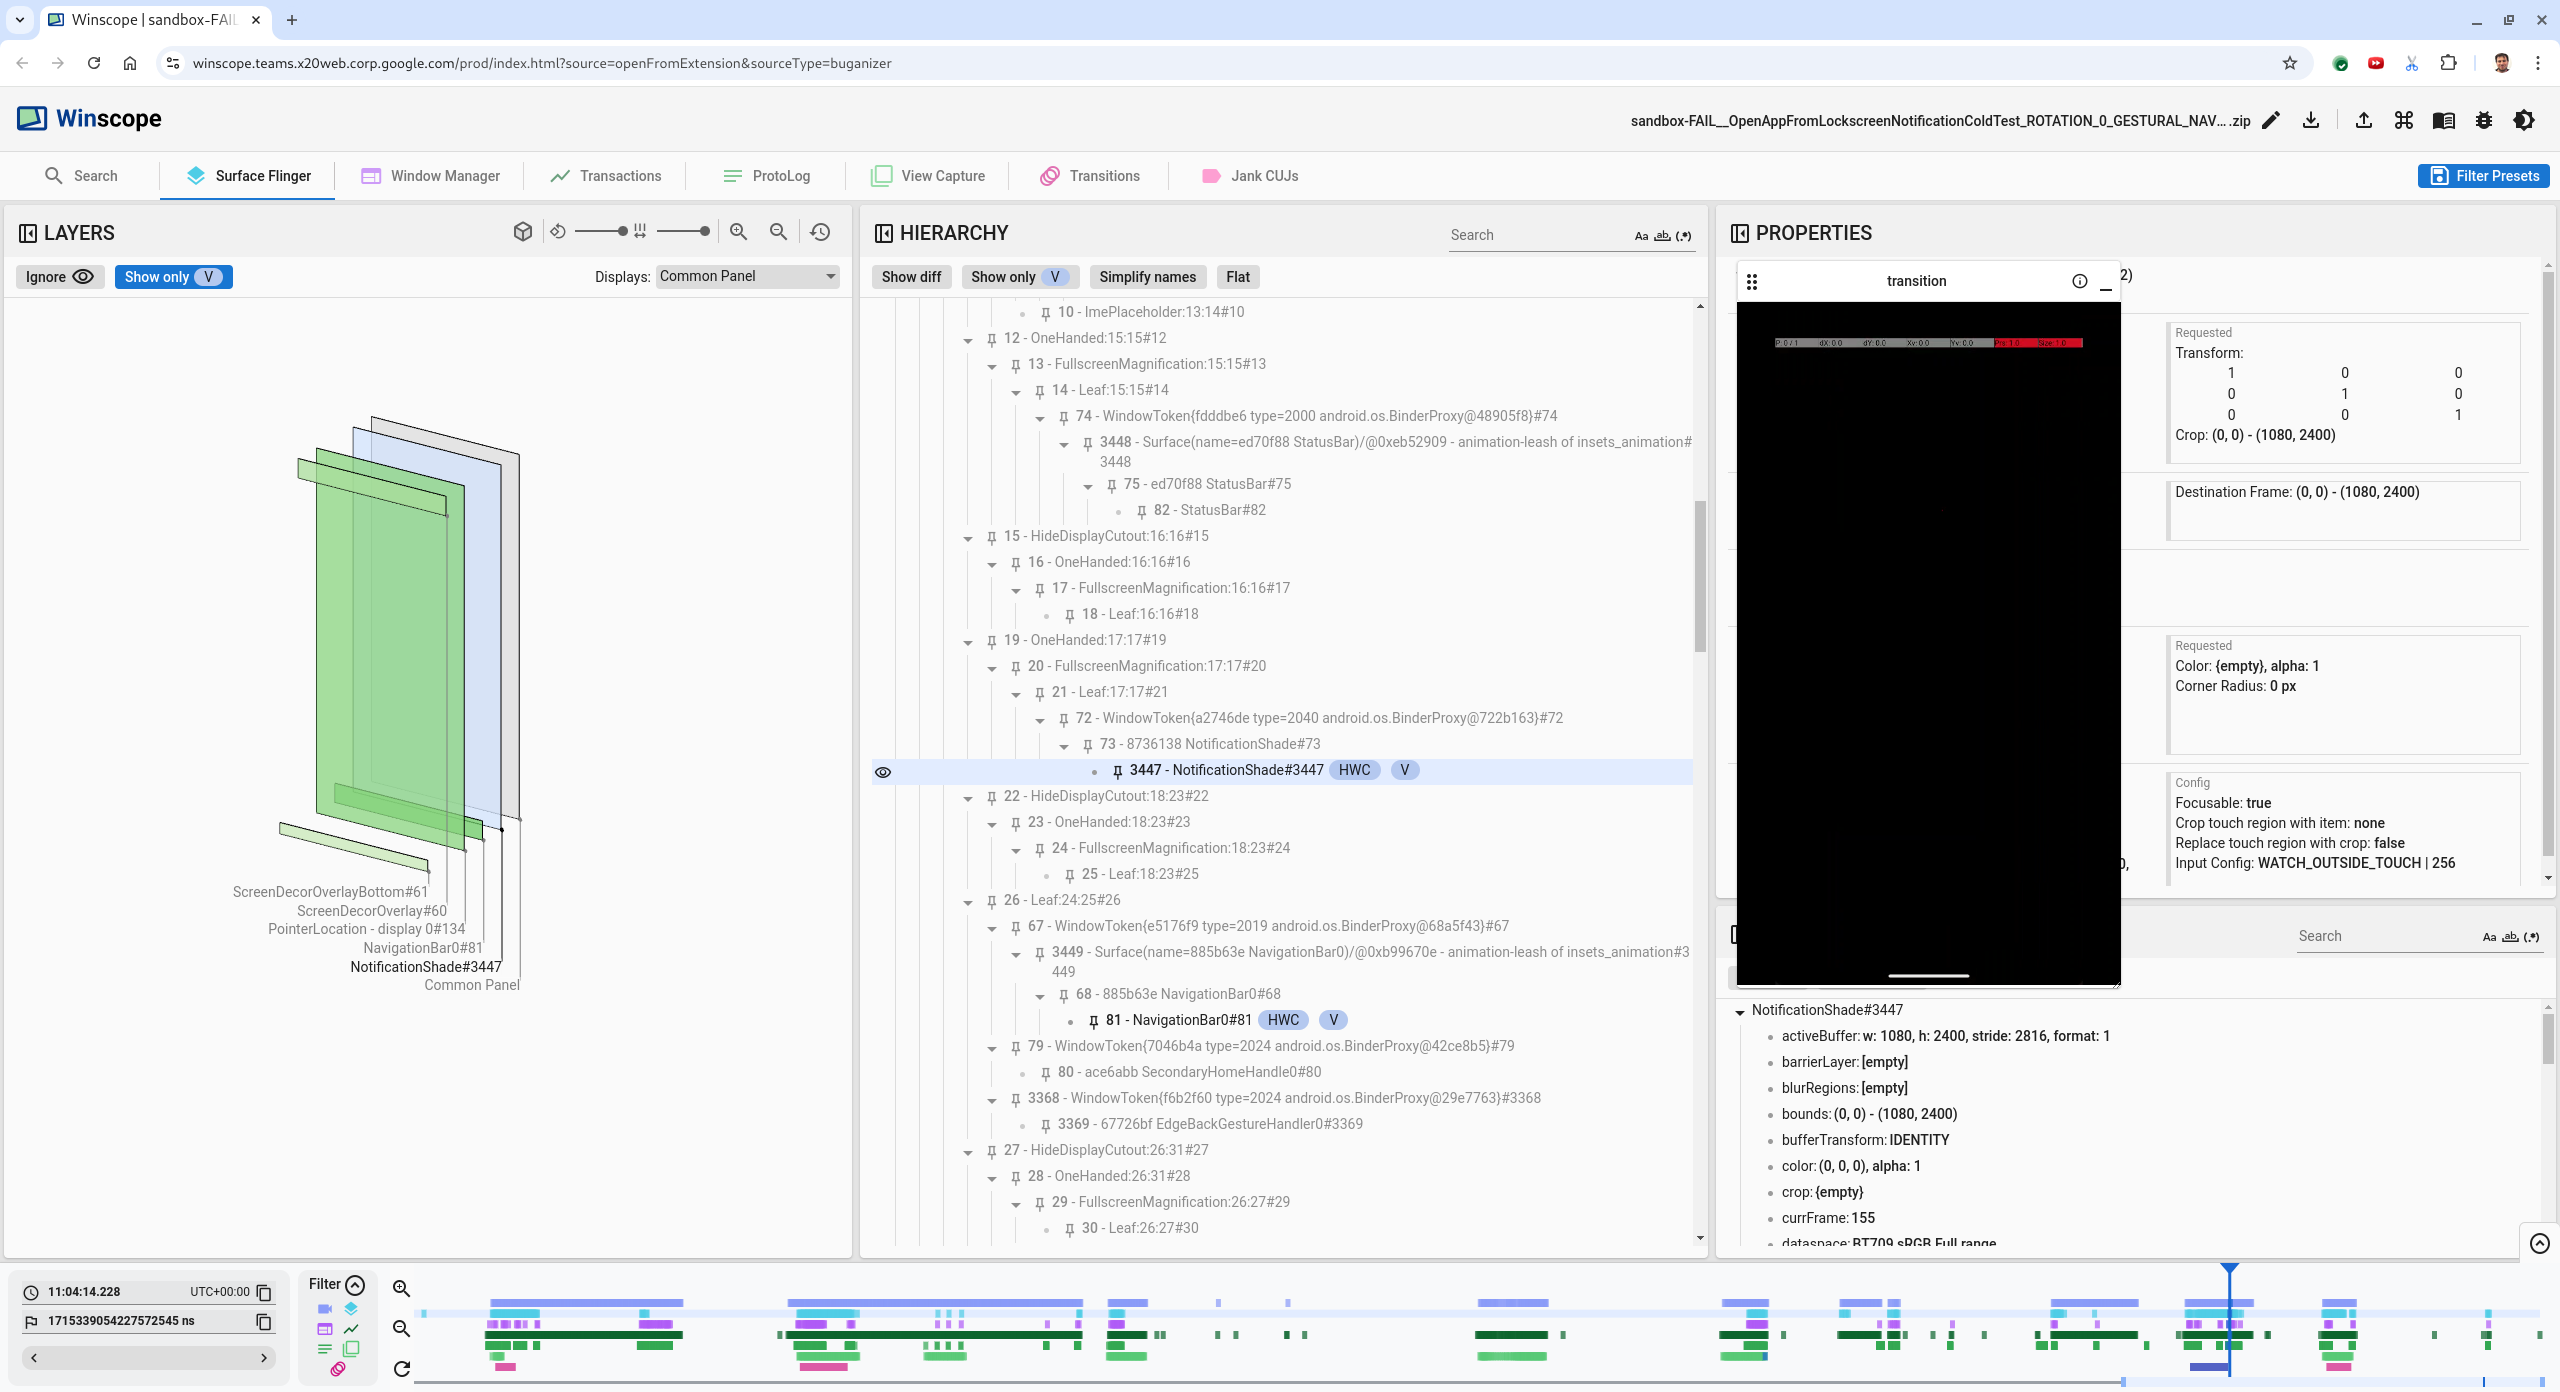
Figure 4. Flicker activity.
Select the app activity in the hierarchy view. If you can't find it, untoggle Show only V. Then, inspect the properties view.
The app surface name is:
com.android.server.wm.flicker.testapp/com.android.server.wm.flicker.testapp.NotificationActivity#3458`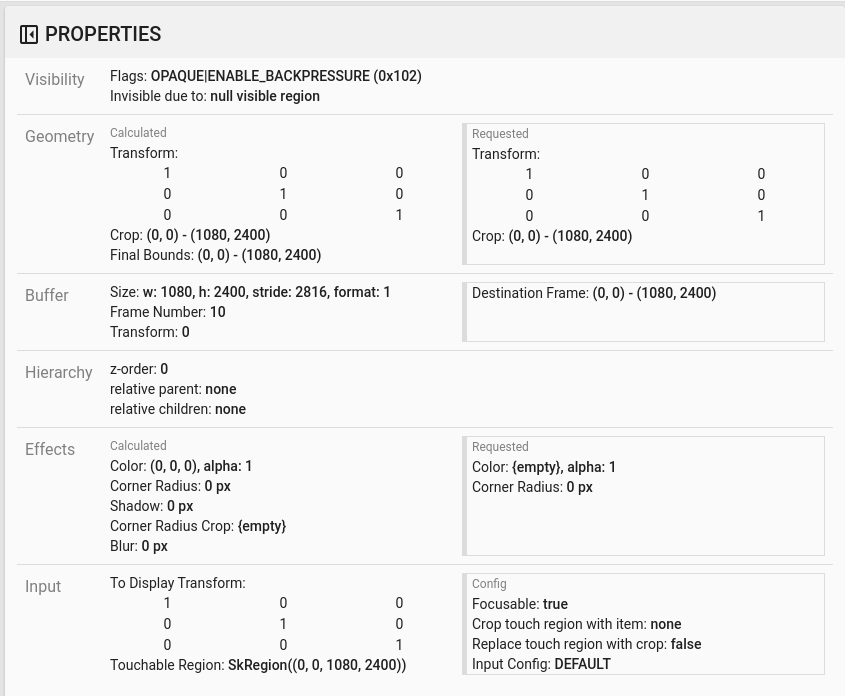
Figure 5. App properties.
Although the app activity is set to visible and opaque, the surface isn't shown due to an
Invisible due to: null visible regionerror. This occurs because another opaque surface was placed in front of it during composition. This hypothesis stems from theNotificationShaderect being in front of theNotificationActivityrect in the 3D view, and the visible (green)NotificationShadepotentially being the chosen layer.To validate this hypothesis, select the visible
NotificationShadesurface on the current frame and check its properties. The flags are set toOPAQUE|ENABLE_BACKPRESSURE (0x102). TheNotificationShadesurface name isNotificationShade#3447. Next, press the left arrow to navigate back to the previous frame (before the flicker) and inspect the properties of theNotificationShadesurface again. Notice that instead of beingOPAQUE, the surface only has theENABLE_BACKPRESSURE (0x100)flag. This confirms thatNotificationShadebecomes opaque before app launch fully finished. Since theNotificationShadeis in front of theNotificationActivity, the app isn't shown. TheNotificationShadeis black, so the screen briefly goes black, which causes the flicker.Identify in the code why the
NotificationShadebecomes opaque too early.
User-reported bug
User-reported bugs can be challenging to debug because they often lack detailed information. Unlike flicker test failures, which provide specific timestamps, element details, and screen recordings, user-reported bugs typically only include a brief description of the issue.
In our case study, the only information provided is the title Screen flickered when reopening app from split screen and an approximate timestamp of Apr 18, 2024 3:51 PM GMT-04:00.
Follow these steps to debug a user-reported bug:
Load the trace file in Winscope. Winscope opens with SurfaceFlinger autoselected.
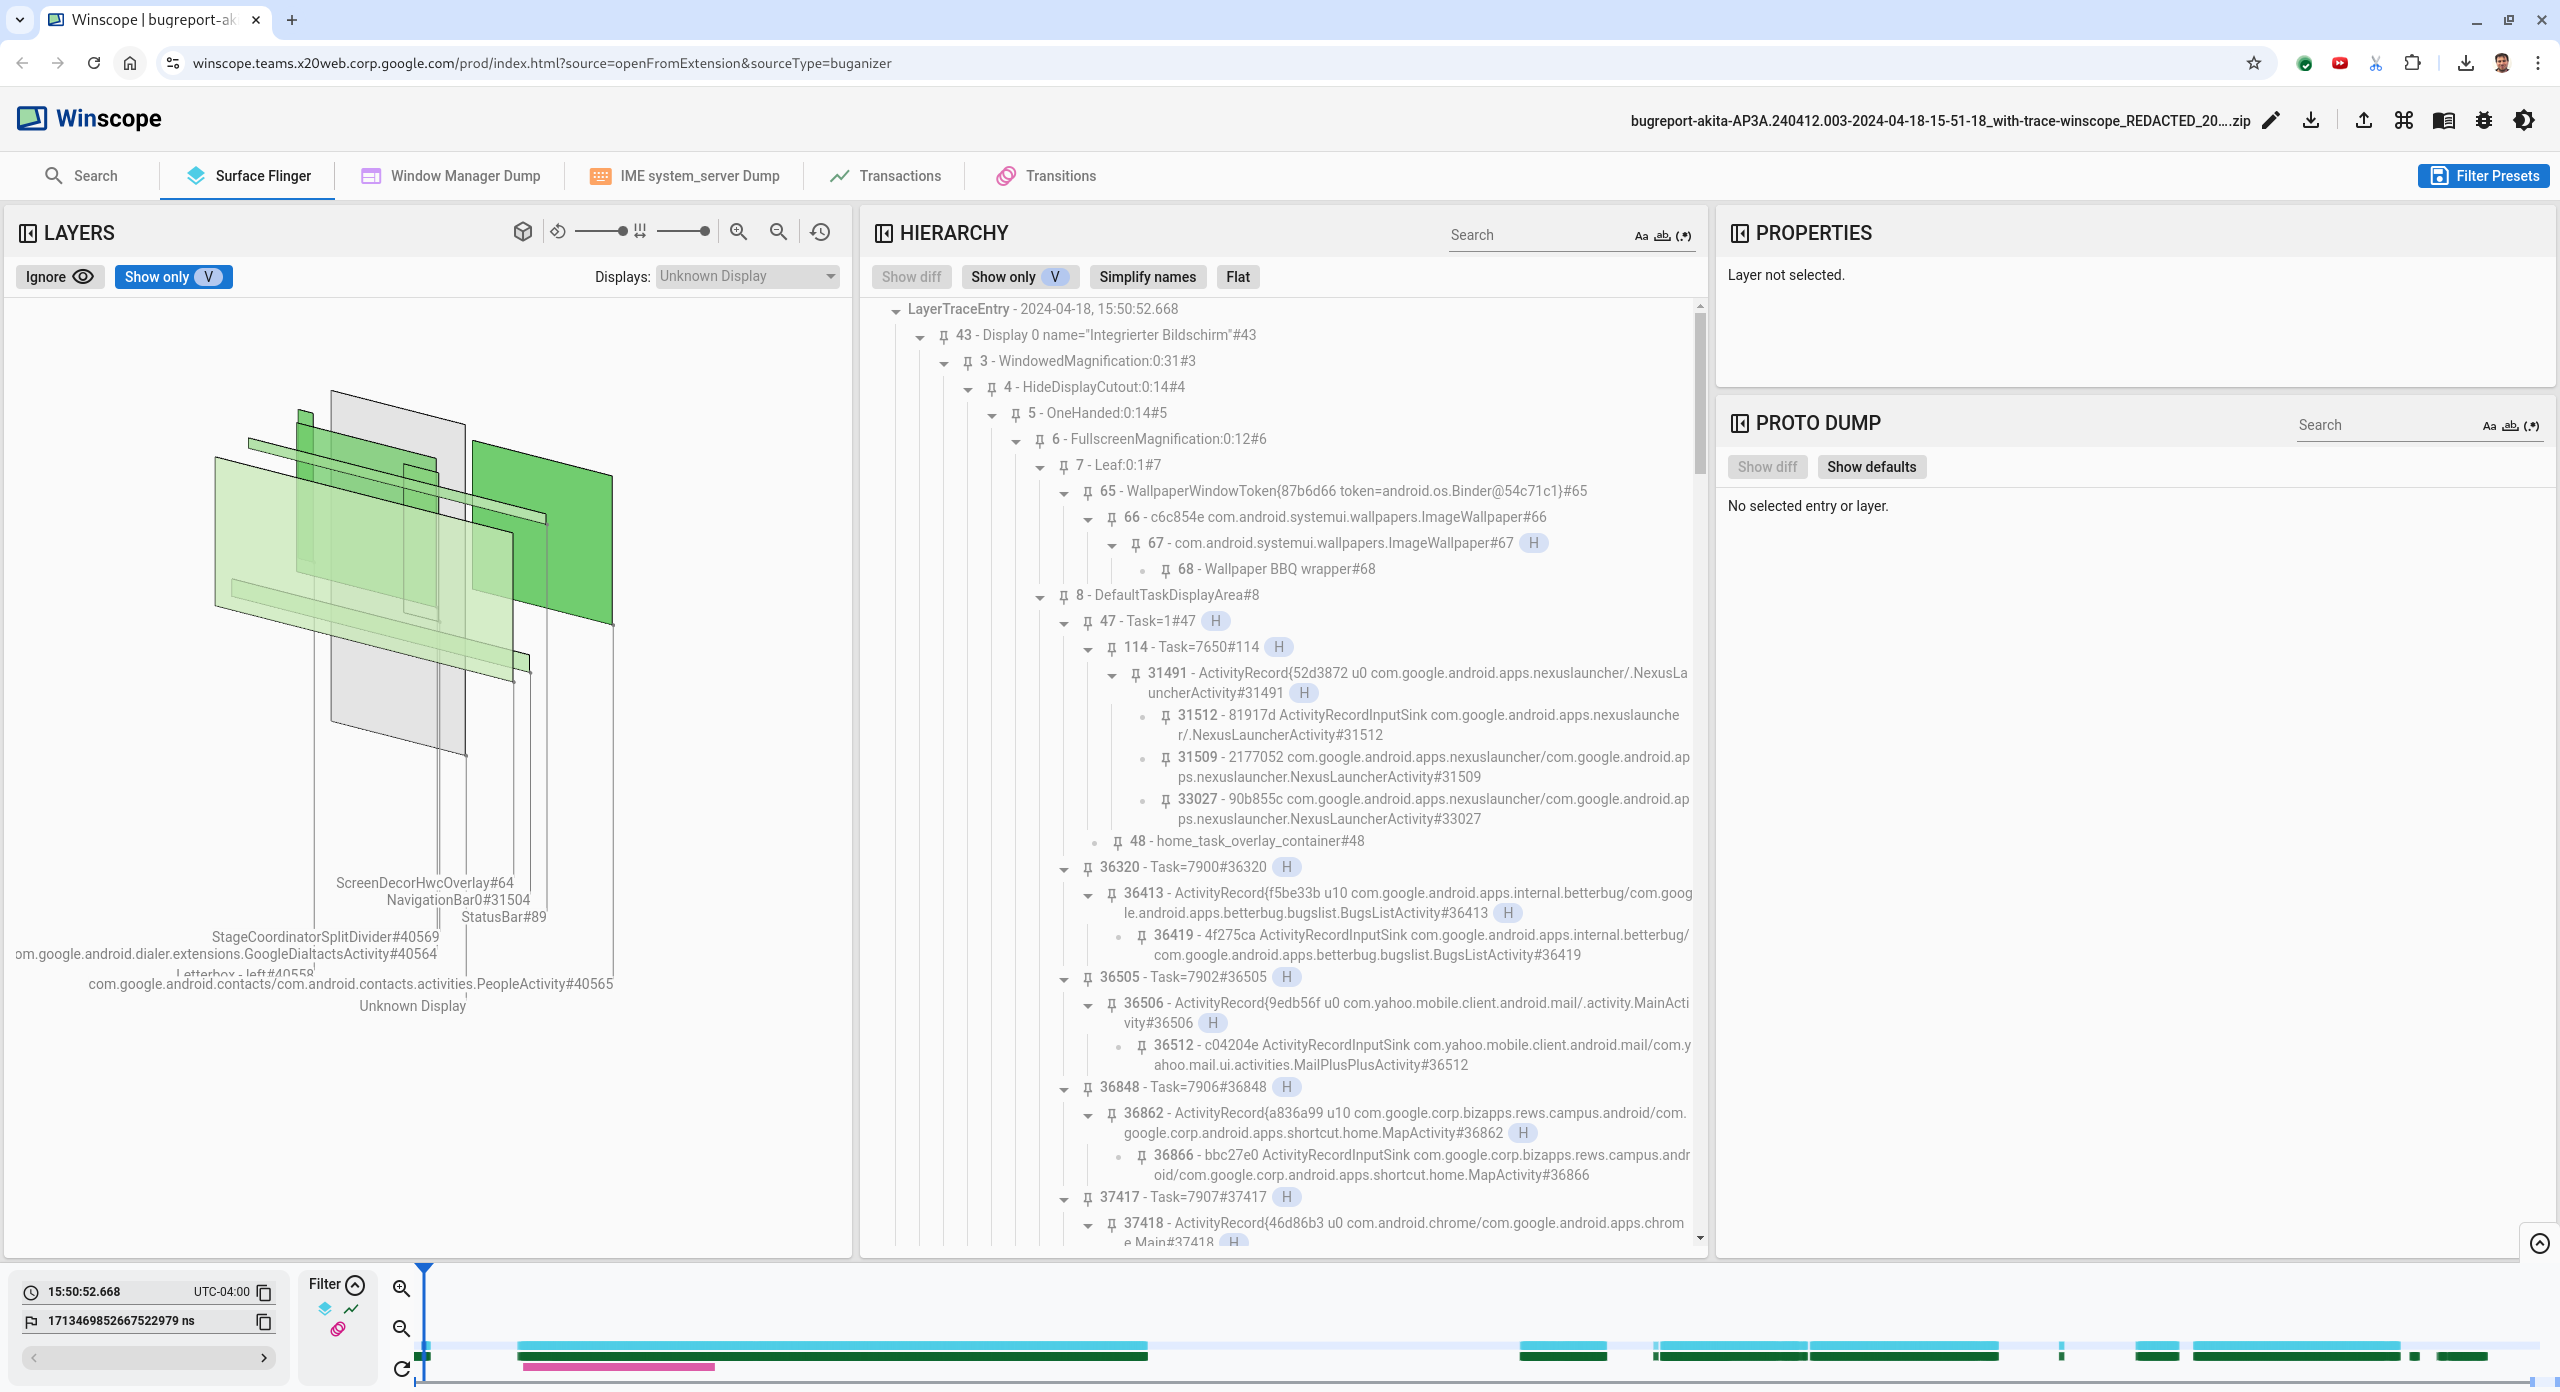
Figure 6. Winscope landing page with SurfaceFlinger view.
Navigate to the approximate timestamp reported by the user, in this case
3:50 PM GMT-04:00, by entering15:50:00in the human-readable timestamp field.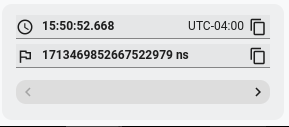
Figure 7. Timestamp dialog.
Use the rects view to identify what was drawn on the screen. For a better view, use the Rotation slider to change the rects perspective. By marking Show only V and Flat in the Hierarchy view, the wallpaper, screen decor overlay, letterbox, launcher, contacts, and dialer surfaces are visible.
The package names are:
- Launcher:
com.google.android.apps.nexuslauncher/com.google.android.apps.nexuslauncher.NexusLauncherActivity#40602 - Contacts:
com.google.android.contacts/com.android.contacts.activities.PeopleActivity#40565 - Dialer:
com.google.android.dialer/com.google.android.dialer.extensions.GoogleDialtactsActivity#40564
In addition to the visible surfaces (green rects), a gray rect, which represents the display area surface, named Unknown display, is displayed. To improve visibility, click the (
 )
next to the
 ScreenDecorHwcOverlay#64surface to hide its corresponding rect and reveal the surfaces behind. We remove the overlay for the analysis because it isn't visible to the user and wouldn't be reported as a flickering animation.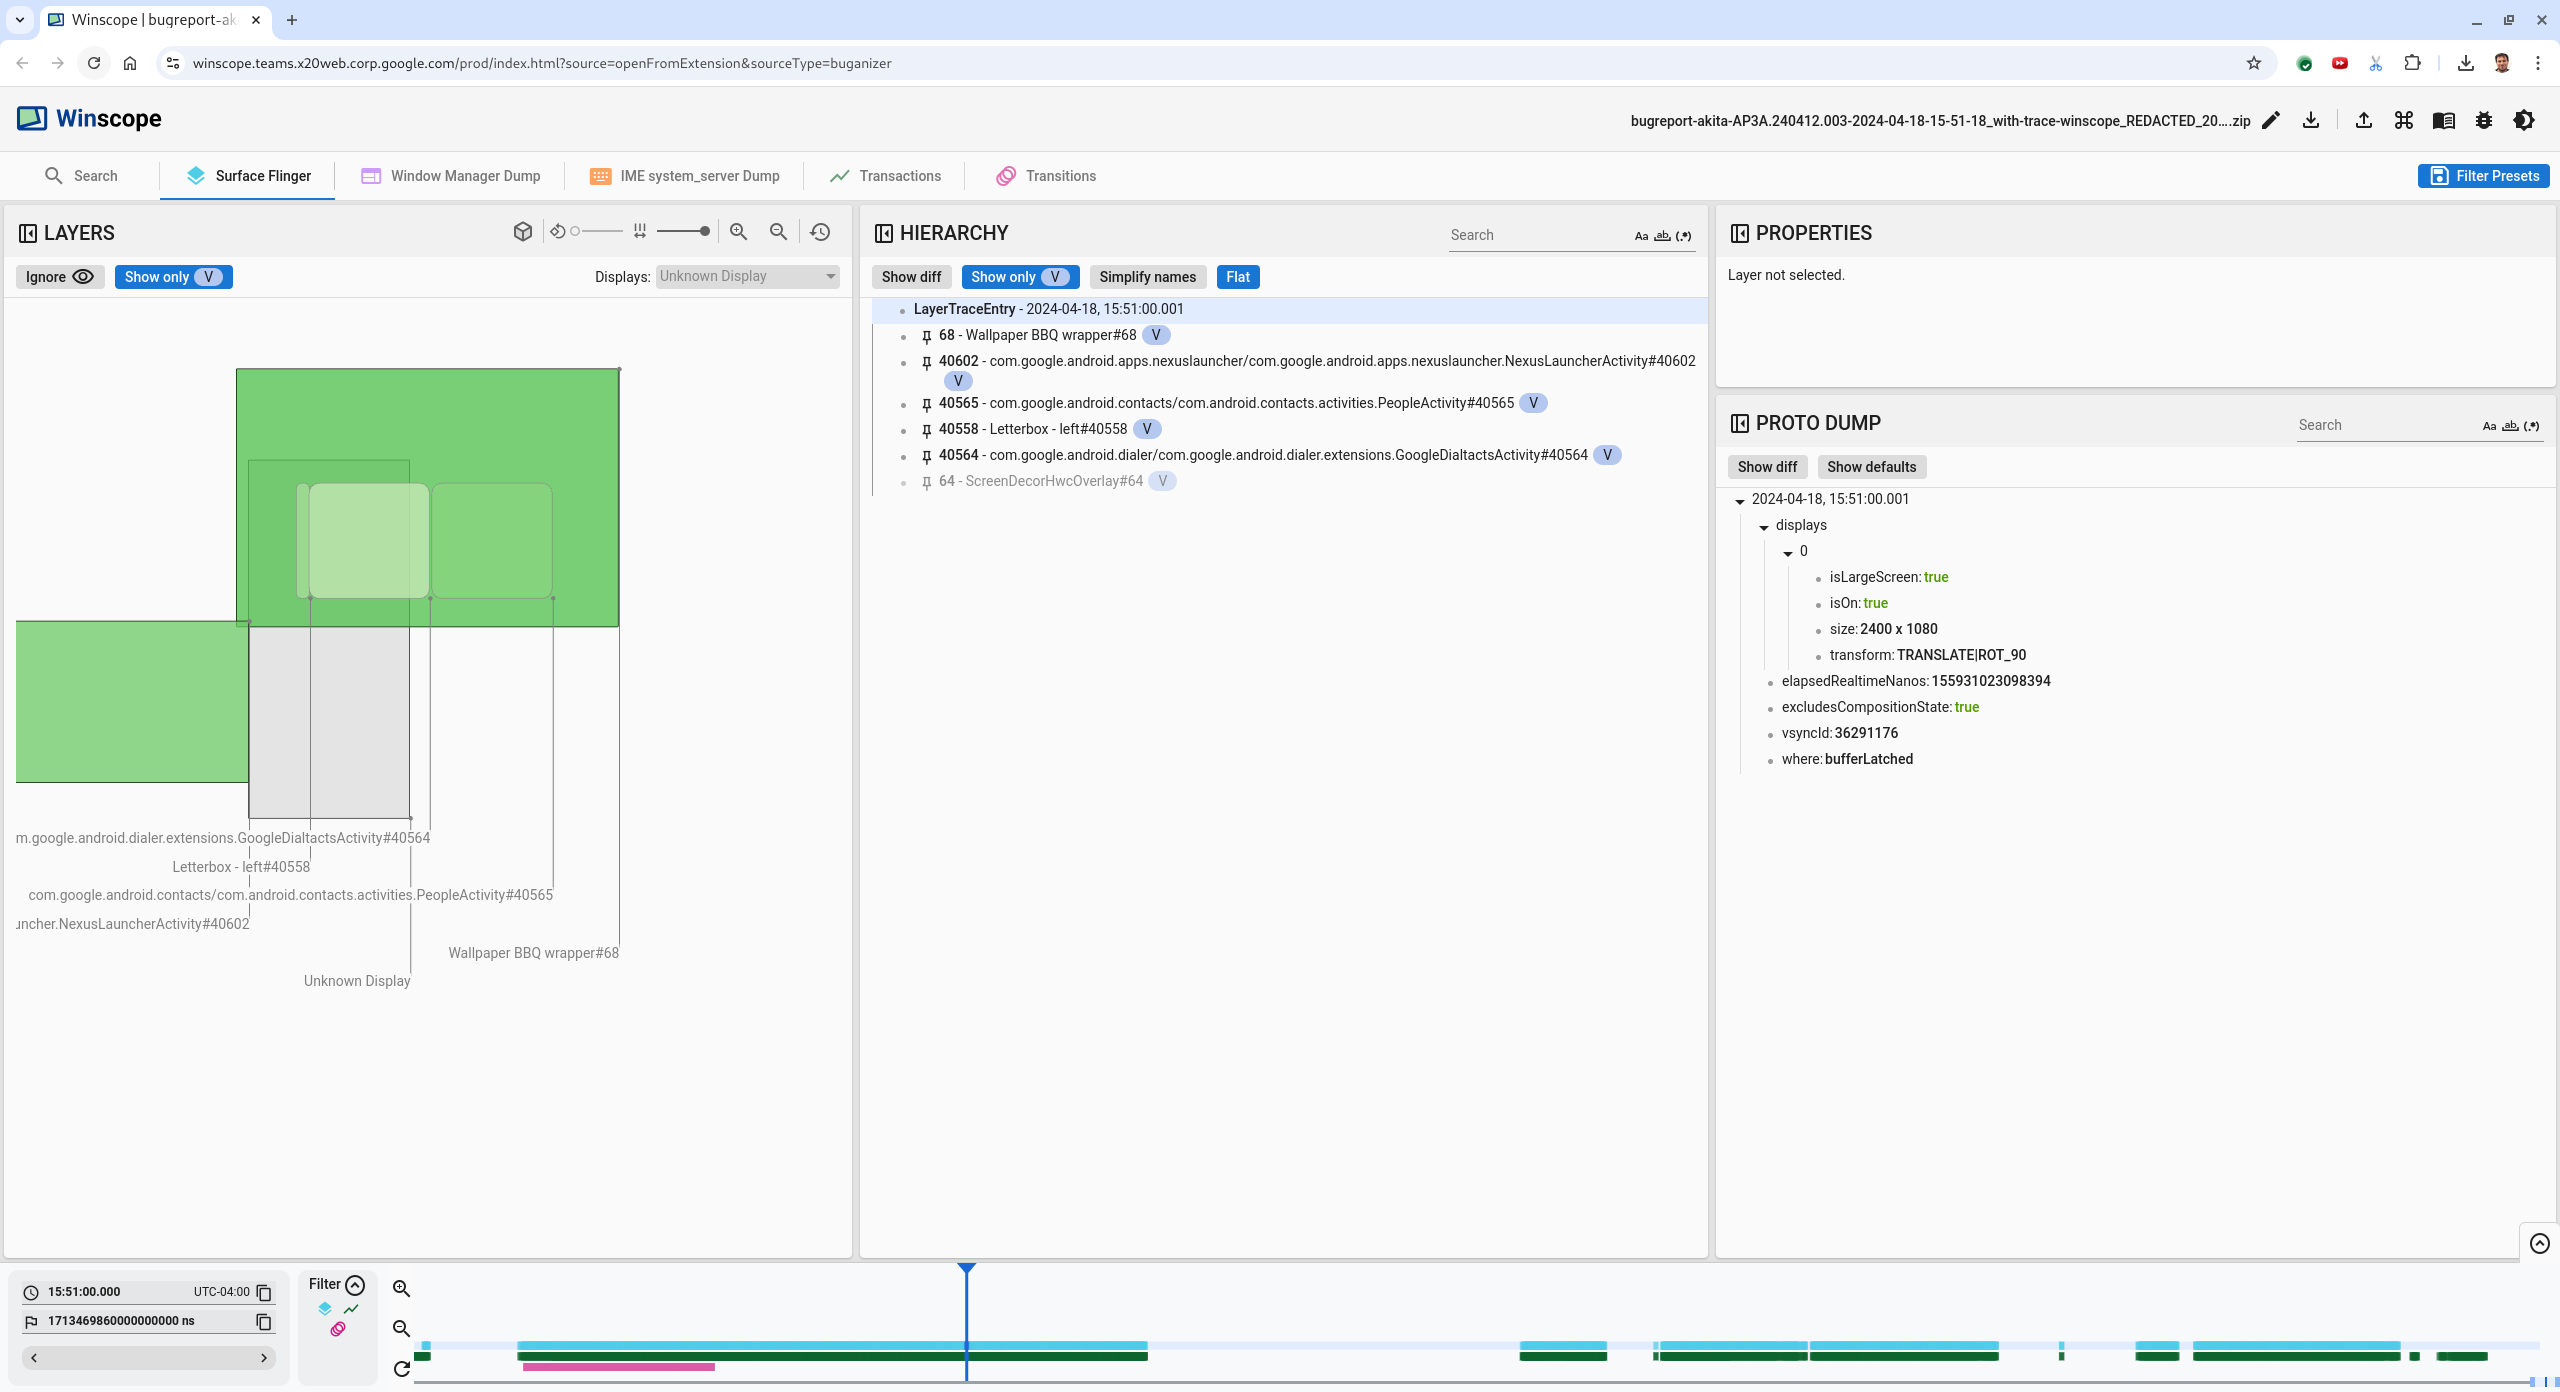
Figure 8. User report.
- Launcher:
After you identify which surfaces are involved in the split screen view, use the Transitions trace to step through various user actions and find the flicker. Click the Transitions tab in Winscope to visualize the list of played transitions:
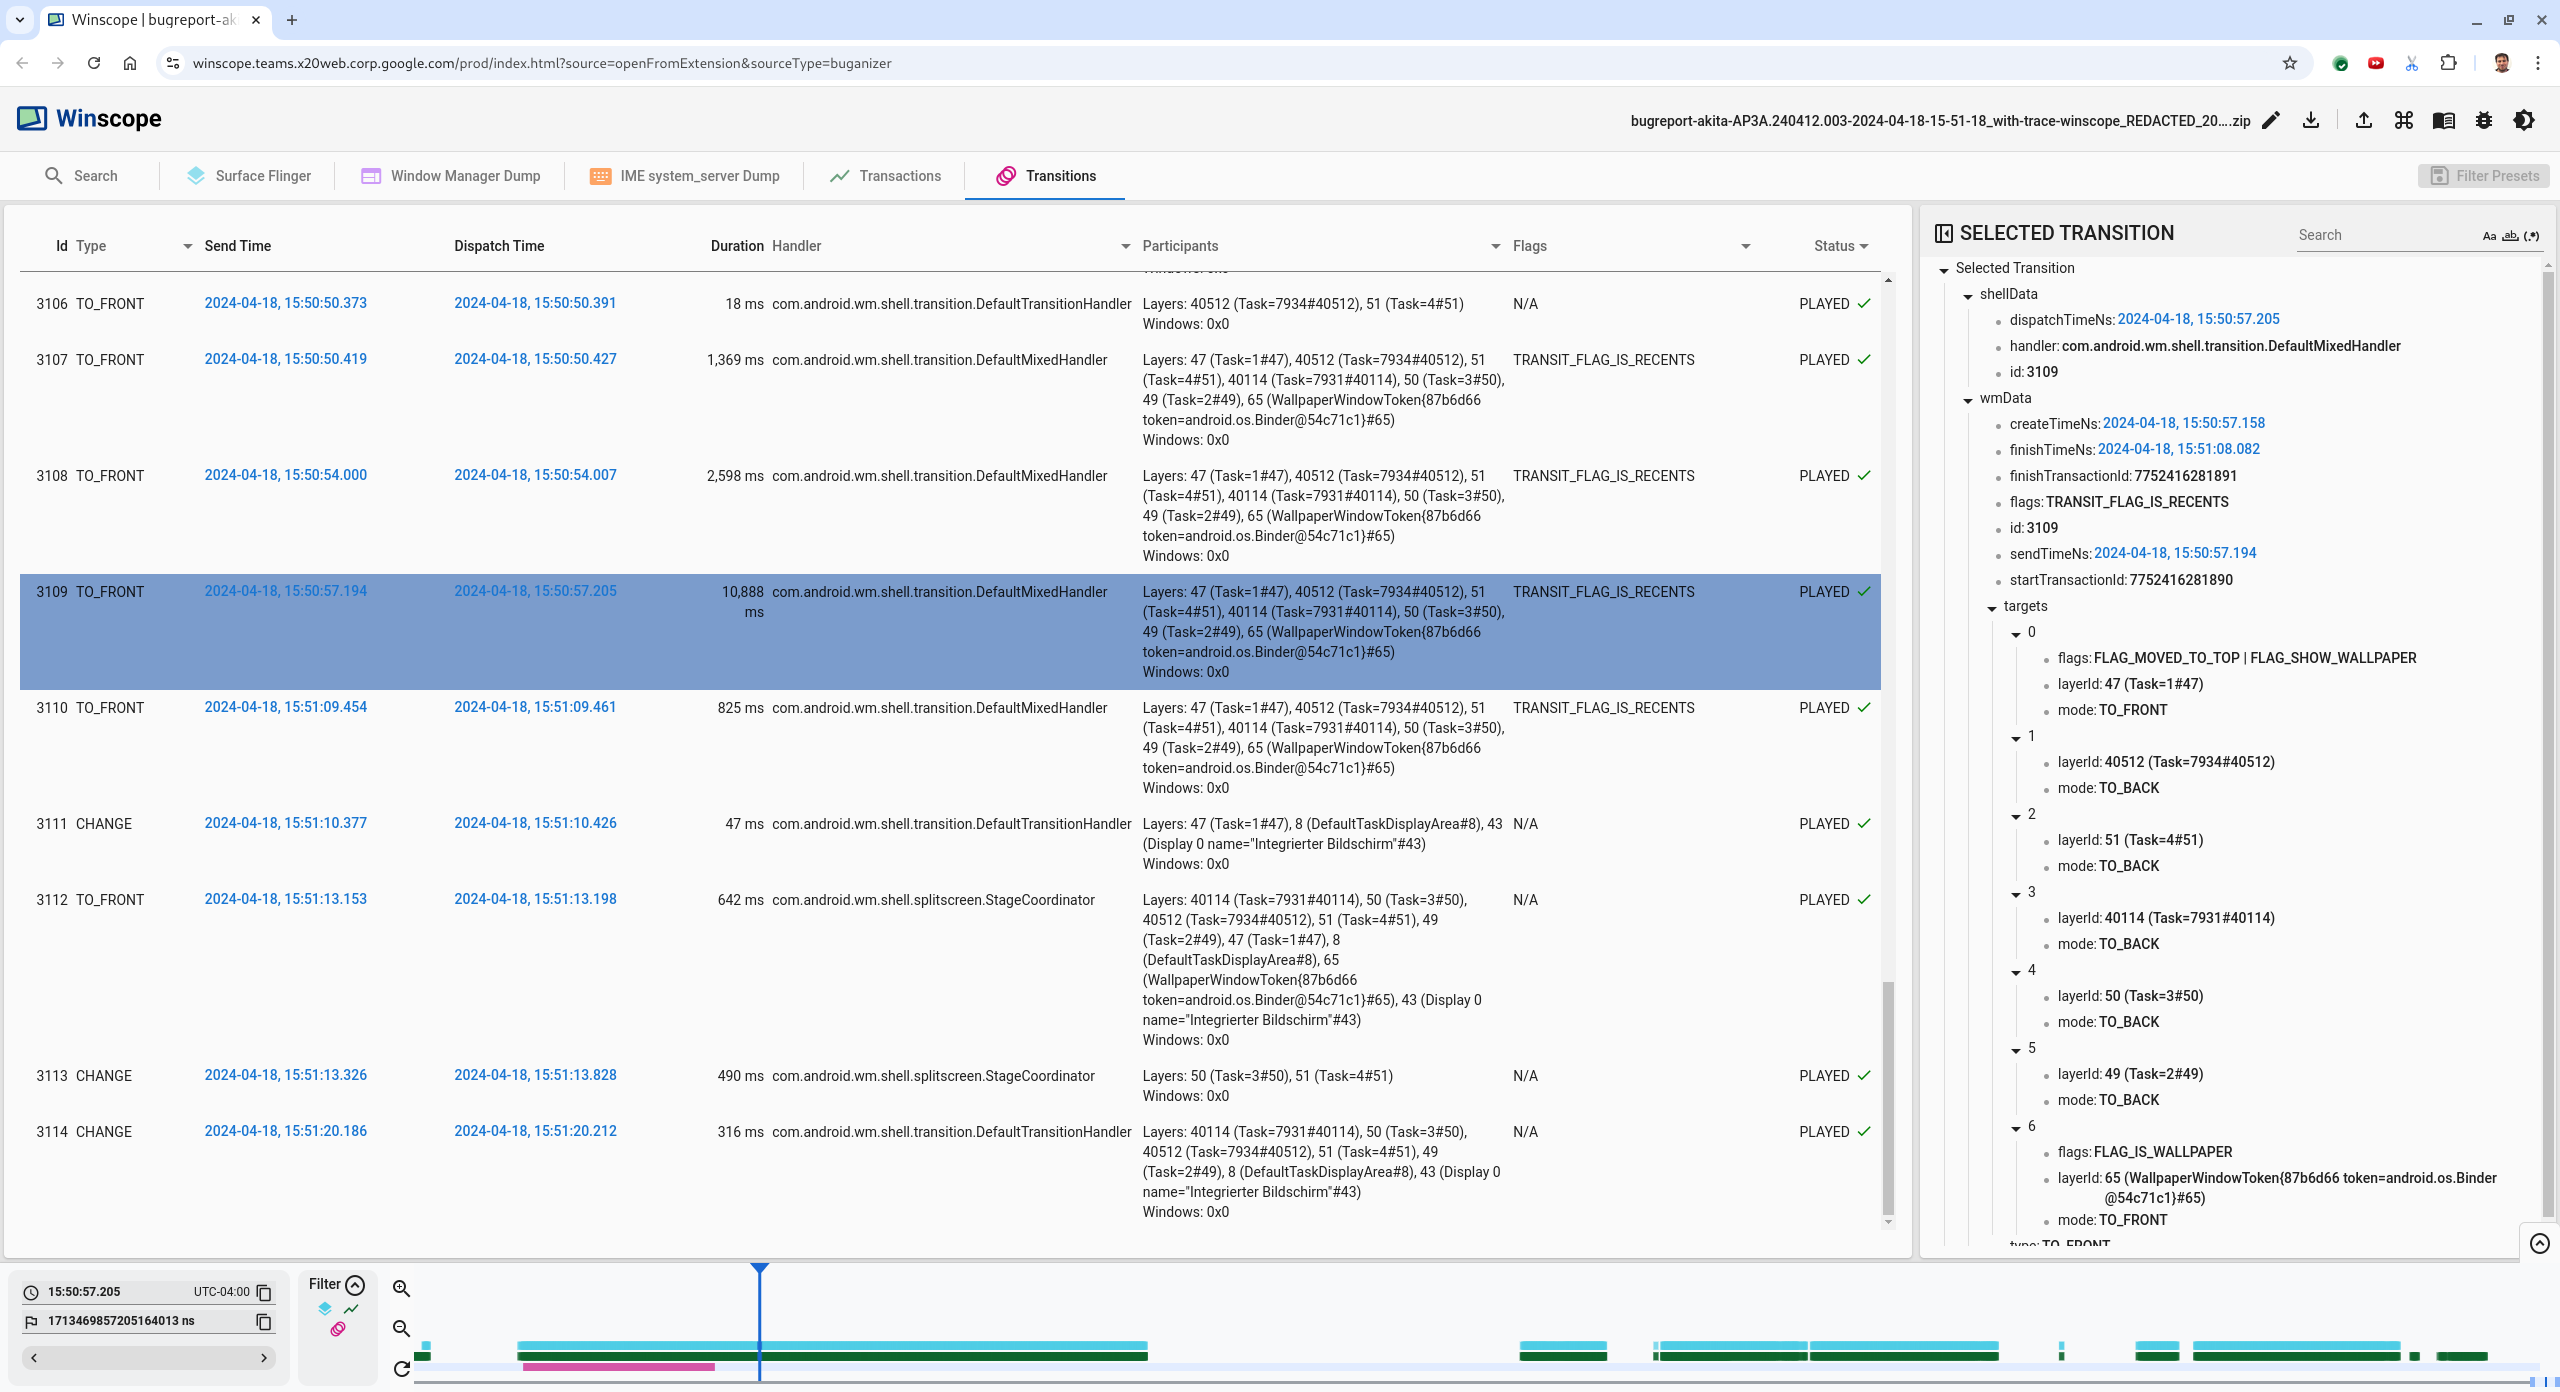
Figure 9. Transitions.
The transition played during this frame is highlighted in blue. In this case, the transition flags include
TRANSIT_FLAG_IS_RECENTS, which indicates that the user is entering the recents screen.Click the link on the Dispatch Time column (in this case
2024-04-18,
15:50:57.205
) to navigate to that point in time and verify the rects in the Surface Flinger tab. Confirm the correctness of the device's state during the transition by stepping through the transition with the right arrow key and observing the rects.The Launcher appears at 15:50:57.278, but the animation doesn't start then. The wallpaper is already visible because nothing is drawn between the split-screen apps (divider). One frame earlier (15:50:57.212), the wallpaper isn't visible, and the divider is shown, which is how the split-screen looks when not animating.
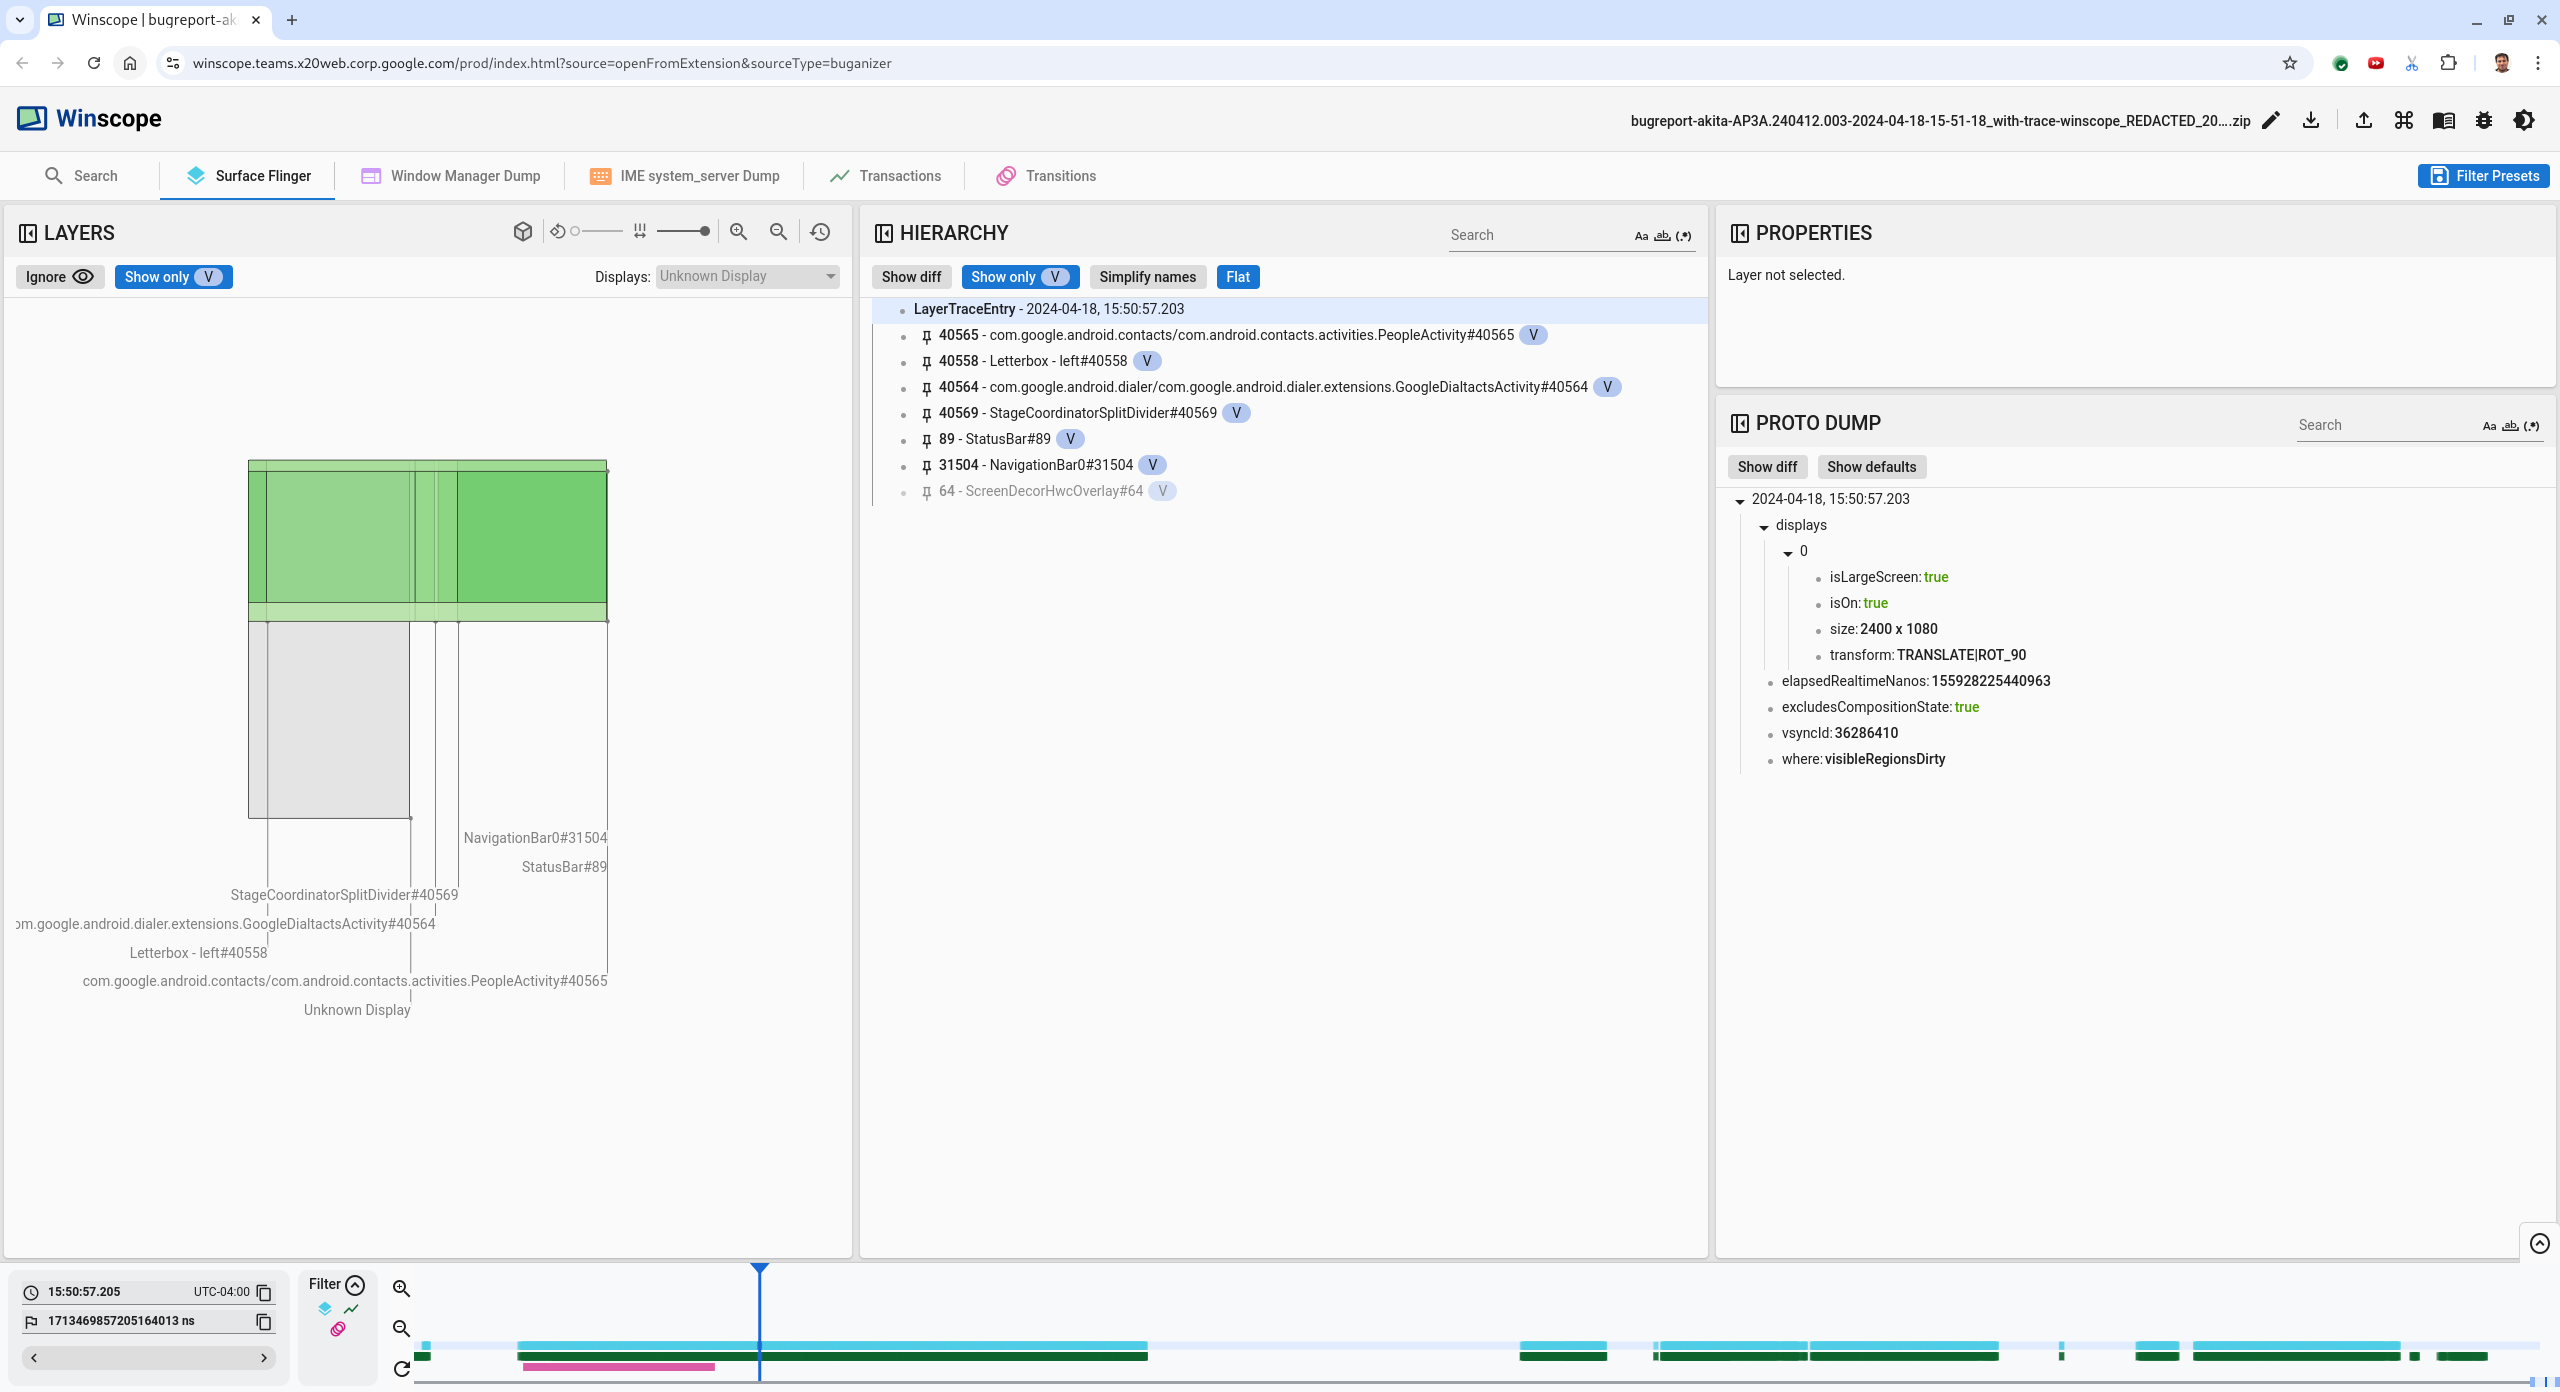
Figure 10. Screen before flicker event.
To check out the next transition, click the timeline directly. SurfaceFlinger states are represented by a row of light blue blocks. Transitions are represented by a row of pink blocks.

Figure 11. End of first transition.
Click the SurfaceFlinger row at the start position of the next transition. In figure 11, the vertical position of the cursor is indicated by the thin blue line. The SurfaceFlinger row's light blue background shows its horizontal position. Step through the transition with the right arrow key to see if a flicker occurs. Confirm that the device looks correct for this transition.
Skip the next transition as its duration is very small, so it's unlikely to contain a flicker. Instead, click the timeline in the SurfaceFlinger row at the start position of the next longer transition, as indicated by the cursor in the following image.

Figure 12. End of second transition.
During this transition, at
15:51:13.239, observe that theSplash Screenlayers for both apps, the contacts, and the dialer, are on the same side of the display: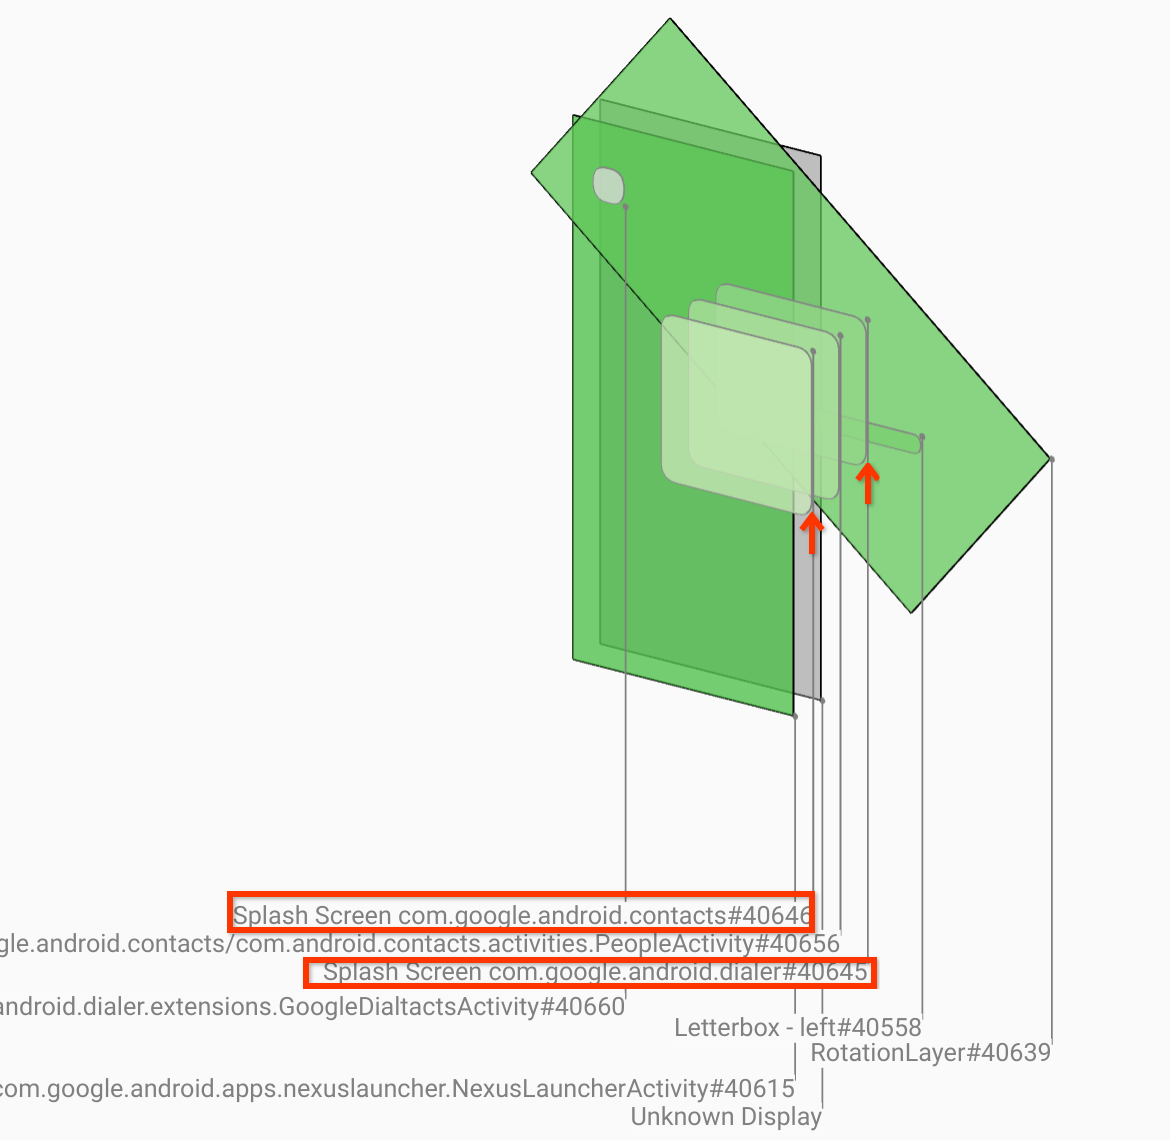
Figure 13. Splash screens.
Clarify which app is on the wrong side. Add a bookmark to your current position by clicking the flag icon next to the ns input field, to help navigate back to this frame later.
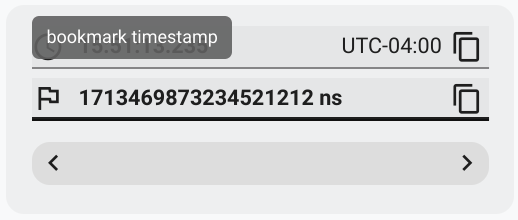
Figure 14. Add bookmark.
Navigate to a frame at the end of the transition by clicking the timeline directly, for example, to
15:51:13.859. Here the two apps are now in their final position, with the dialer on the left, and contacts on the right: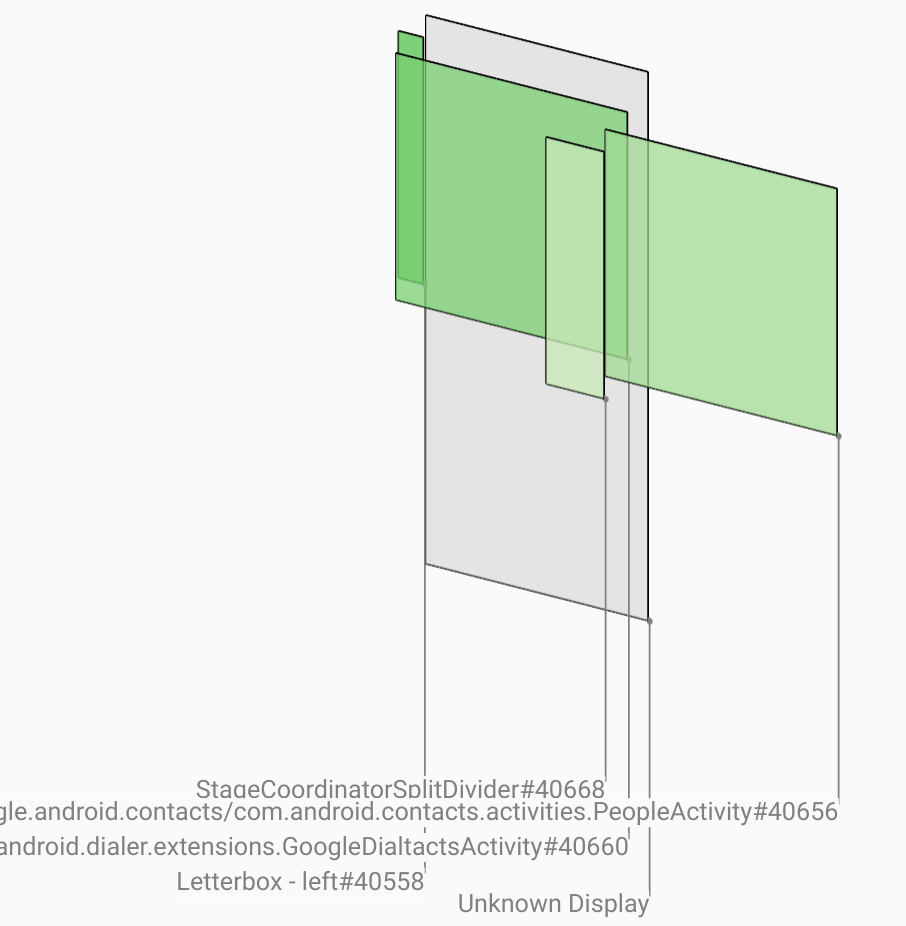
Figure 15. Final split screen.
Click the flag of the bookmark in the timeline to go back to the frame with the flicker.

Figure 16. Bookmark timeline.
Both the apps are on the right, indicating that the dialer is in the wrong position.
Click the dialer's splash screen to view its properties. Look specifically at its transform properties in the curated Properties view.
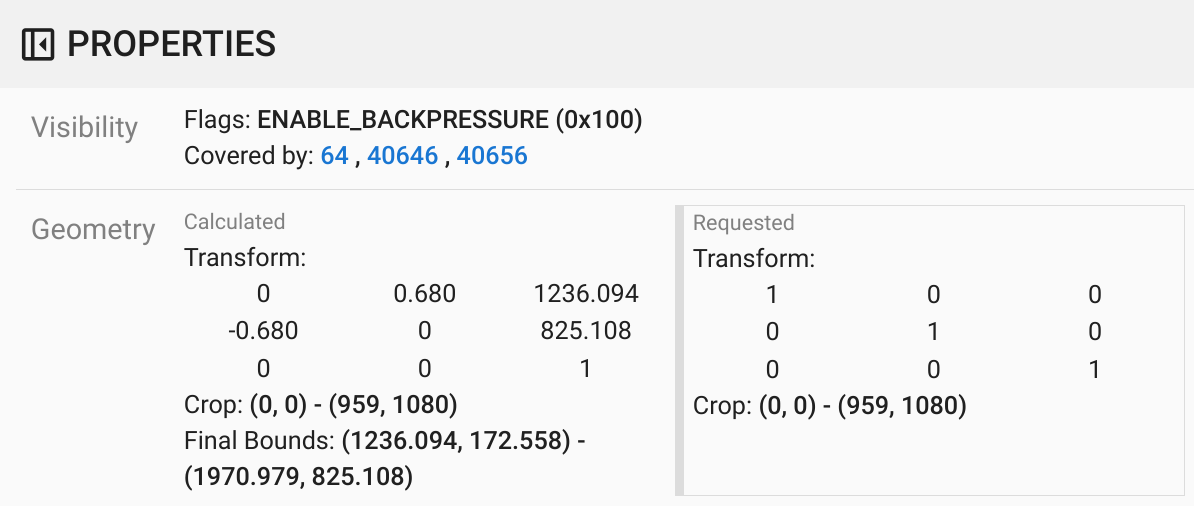
Figure 17. Transform properties.
The calculated transform is applied to this surface, but not set at this level. The calculated and requested columns have different values, indicating that the transform is being inherited from a parent surface.
Deselect Flat in the hierarchy view to show the entire hierarchy tree, and navigate to the parent nodes of the app surface until both Calculated and Requested transforms are the same, showing the transform being requested on the
Surface(name=Task=7934)/@0x1941191_transition-leash#40670surface.Confirm when the transform was first set, and to what value. Collapse the curated properties by clicking the icon next to the title:
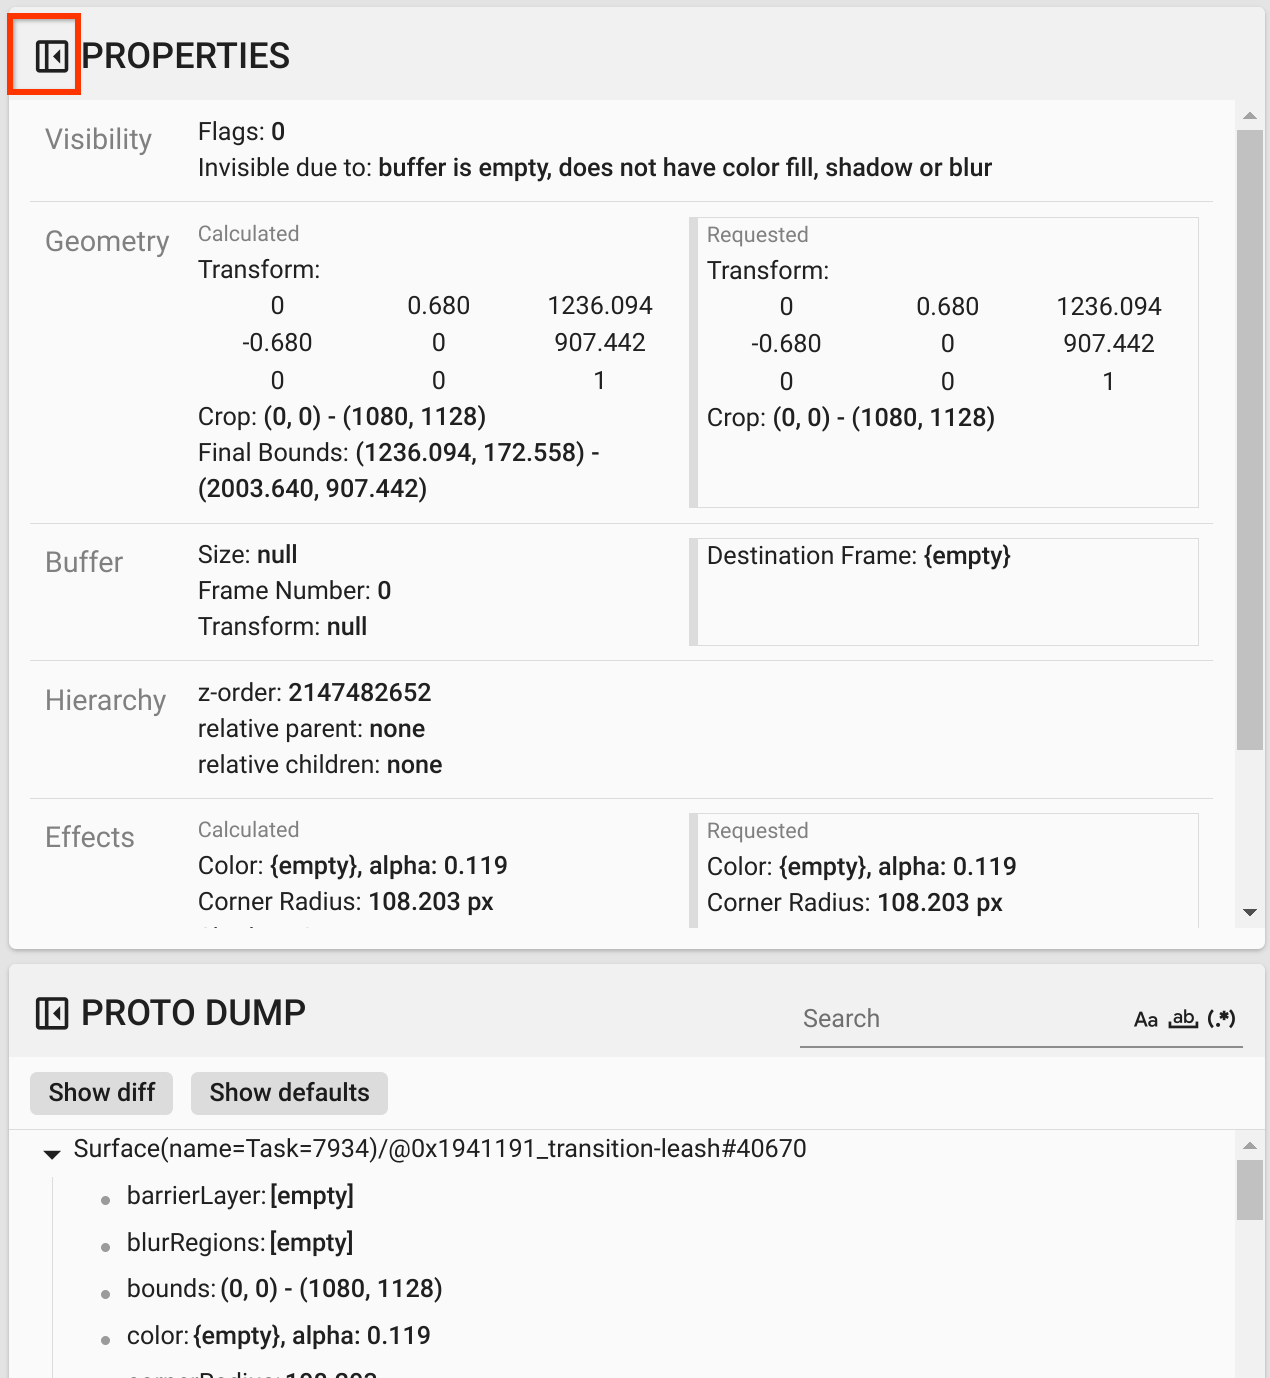
Figure 18. Collapse the curated properties.
Select Show diff in the Proto Dump view to highlight the properties that are being changed in this frame. Type
transforminto the text search field to filter the properties: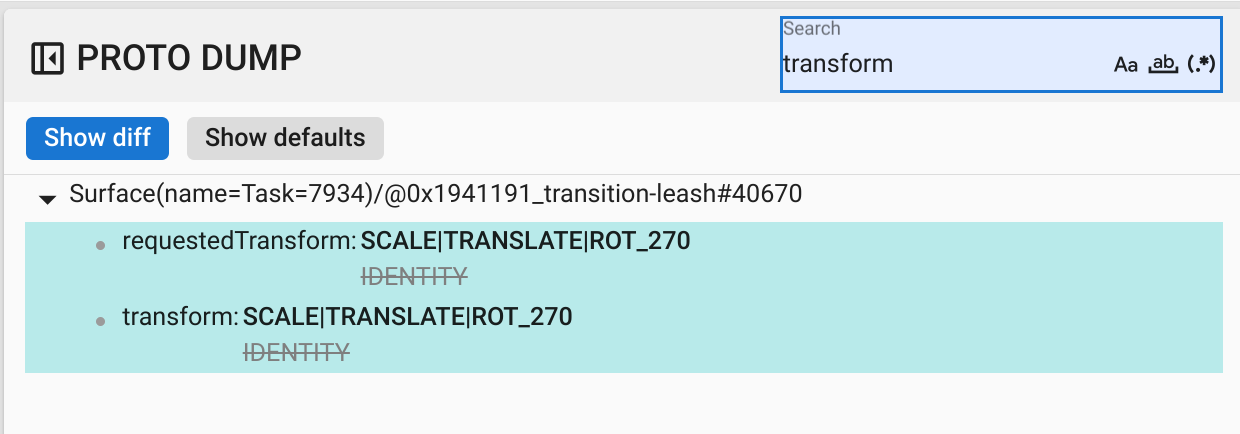
Figure 19. Show diff.
The transform is set from
IDENTITYtoSCALE|TRANSLATE|ROT_270in this frame for thetransition-leash.This information shows that the flicker occurred when the transform was applied to the animation leash of the dialer split screen app.
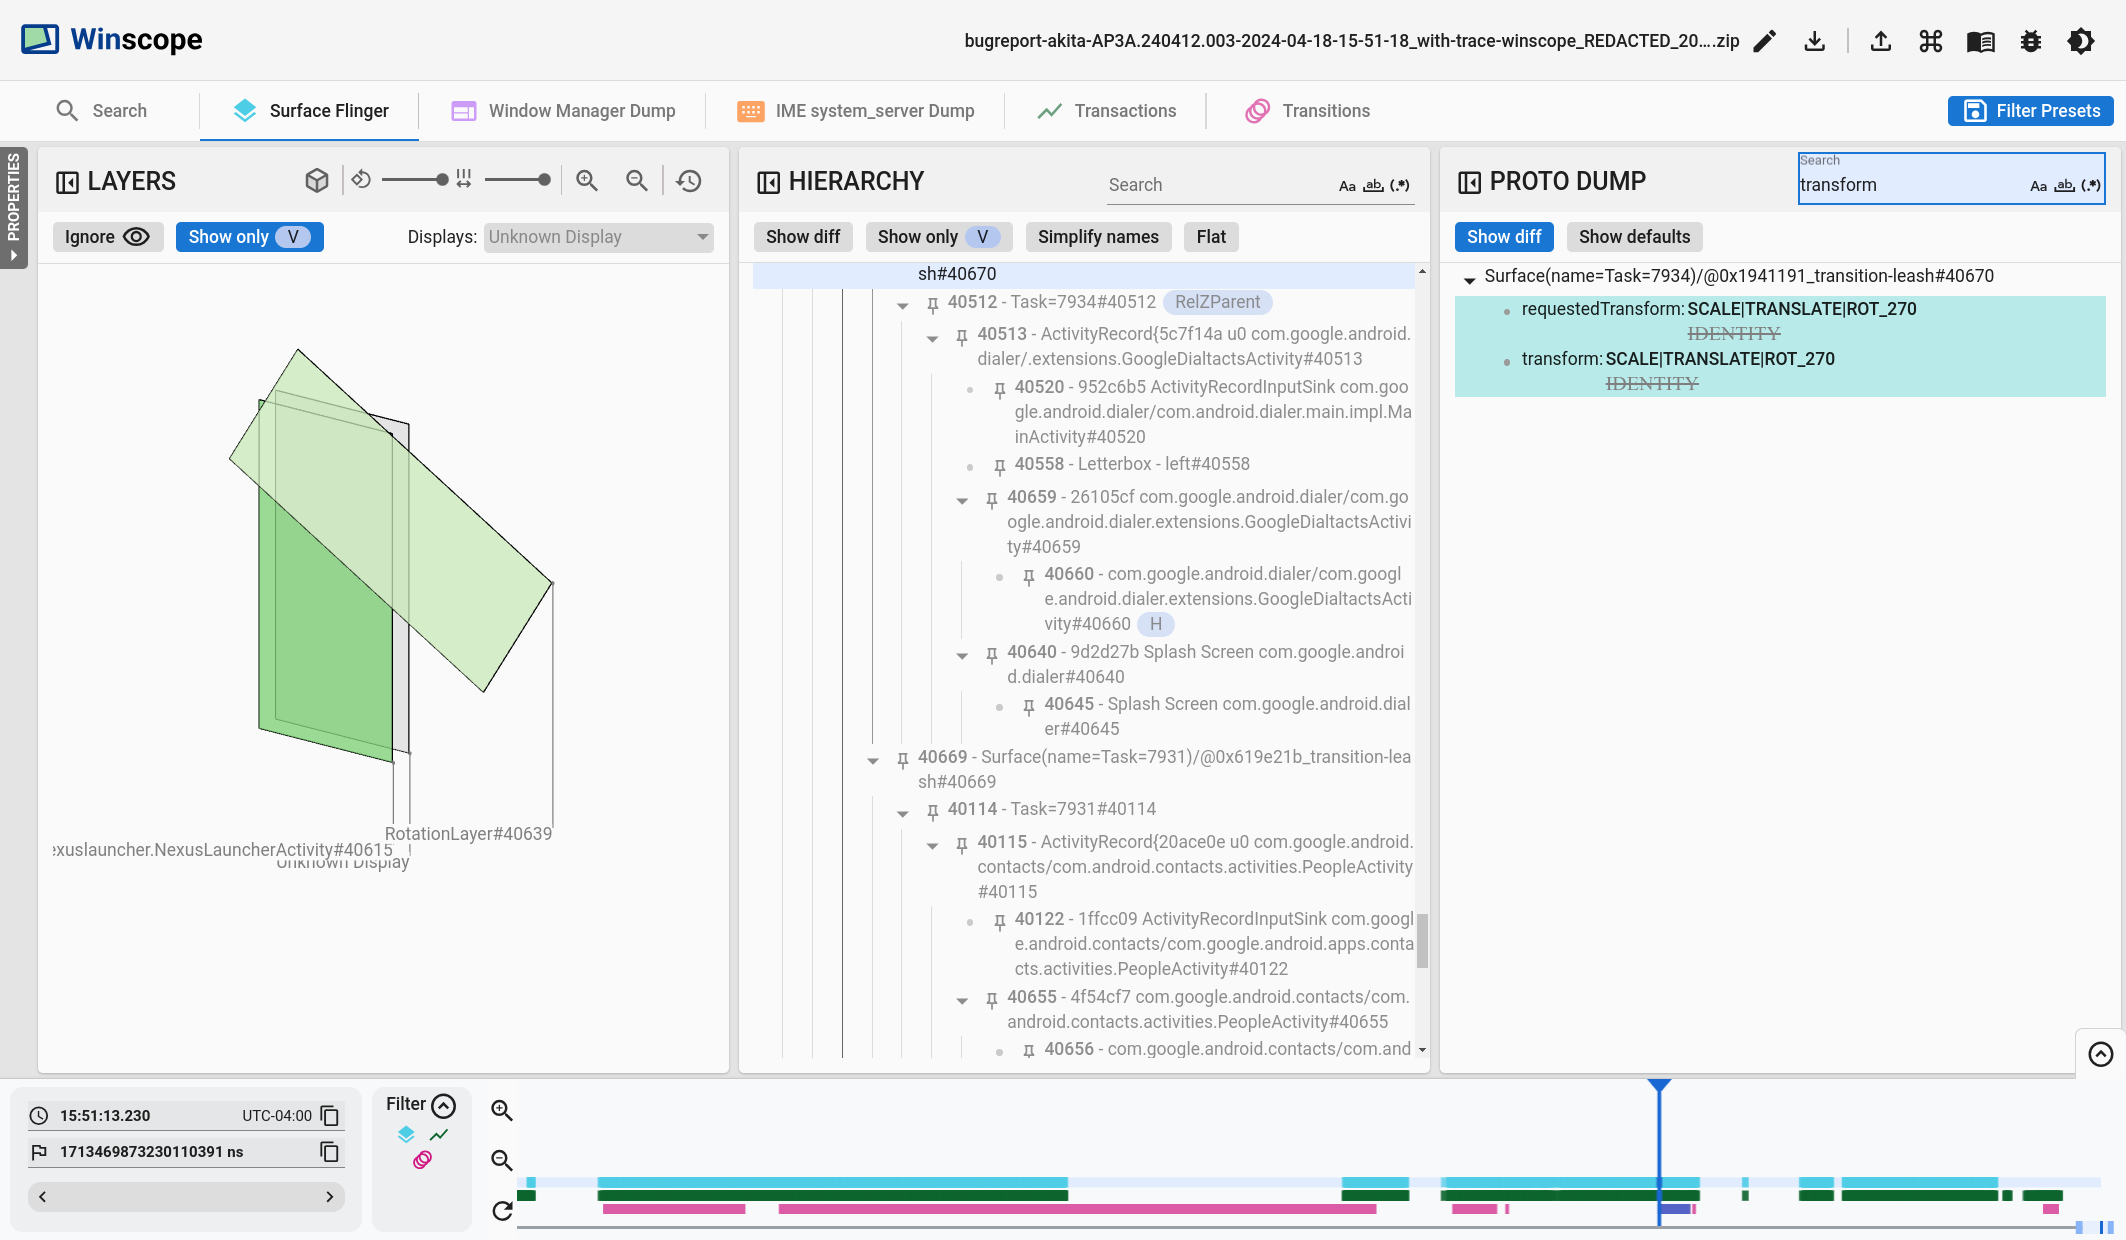
Figure 20. Identification of the flicker.
Identify in the code why this transform is set to the split screen transition leash.
