
systrace is the primary tool for analyzing Android device performance. However, it's really a wrapper around other tools. It's the host-side wrapper around atrace, the device-side executable that controls userspace tracing and sets up ftrace, and the primary tracing mechanism in the Linux kernel. systrace uses atrace to enable tracing, then reads the ftrace buffer and wraps it all in a self-contained HTML viewer. (While newer kernels have support for Linux Enhanced Berkeley Packet Filter (eBPF), this page pertains to the 3.18 kernel (no eFPF) as that's what was used on the Pixel or Pixel XL.)
systrace is owned by the Google Android and Google Chrome teams and is open source as part of the Catapult project. In addition to systrace, Catapult includes other useful utilities. For example, ftrace has more features than can be directly enabled by systrace or atrace and contains some advanced functionality that is critical to debugging performance problems. (These features require root access and often a new kernel.)
Run systrace
When debugging jitter on Pixel or Pixel XL, start with the following command:
./systrace.py sched freq idle am wm gfx view sync binder_driver irq workq input -b 96000
When combined with the additional tracepoints required for GPU and display pipeline activity, this lets you trace from user input to frame displayed on screen. Set the buffer size to something large to avoid losing events (because without a large buffer some CPUs contain no events after some point in the trace).
When going through systrace, keep in mind that every event is triggered by something on the CPU.
Because systrace is built on top of ftrace and ftrace runs on the CPU, something on the CPU must write the ftrace buffer that logs hardware changes. This means that if you're curious about why a display fence changed state, you can see what was running on the CPU at the exact point of its transition (something running on the CPU triggered that change in the log). This concept is the foundation of analyzing performance using systrace.
Example: Working frame
This example describes a systrace for a normal UI pipeline. To follow along
with the example, download the zip file of traces
(which also includes other traces referred to in this section), unzip the file,
and open the systrace_tutorial.html file in your browser.
For a consistent, periodic workload such as TouchLatency, the UI pipeline follows this sequence:
- EventThread in SurfaceFlinger wakes the app UI thread, signaling that it's time to render a new frame.
- The app renders a frame in the UI thread, RenderThread, and HWUI tasks, using CPU and GPU resources. This is the bulk of the capacity spent for the UI.
- The app sends the rendered frame to SurfaceFlinger using a binder, then SurfaceFlinger goes to sleep.
- A second EventThread in SurfaceFlinger wakes SurfaceFlinger to trigger composition and display output. If SurfaceFlinger determines that there's no work to be done, it goes back to sleep.
- SurfaceFlinger handles composition using the Hardware Composer (HWC) or Hardware Composer 2 (HWC2) or GL. The HWC and HWC2 composition is faster and lower power but has limitations depending on the system on a chip (SoC). This usually takes about 4 to 6 ms, but can overlap with step 2 because Android apps are always triple buffered. (While apps are always triple buffered, there might be only one pending frame waiting in SurfaceFlinger, which makes it appear identical to double buffering.)
- SurfaceFlinger dispatches the final output to display with a vendor driver and goes back to sleep, waiting for EventThread wakeup.
Here's an example of the frame sequence beginning at 15409 ms:
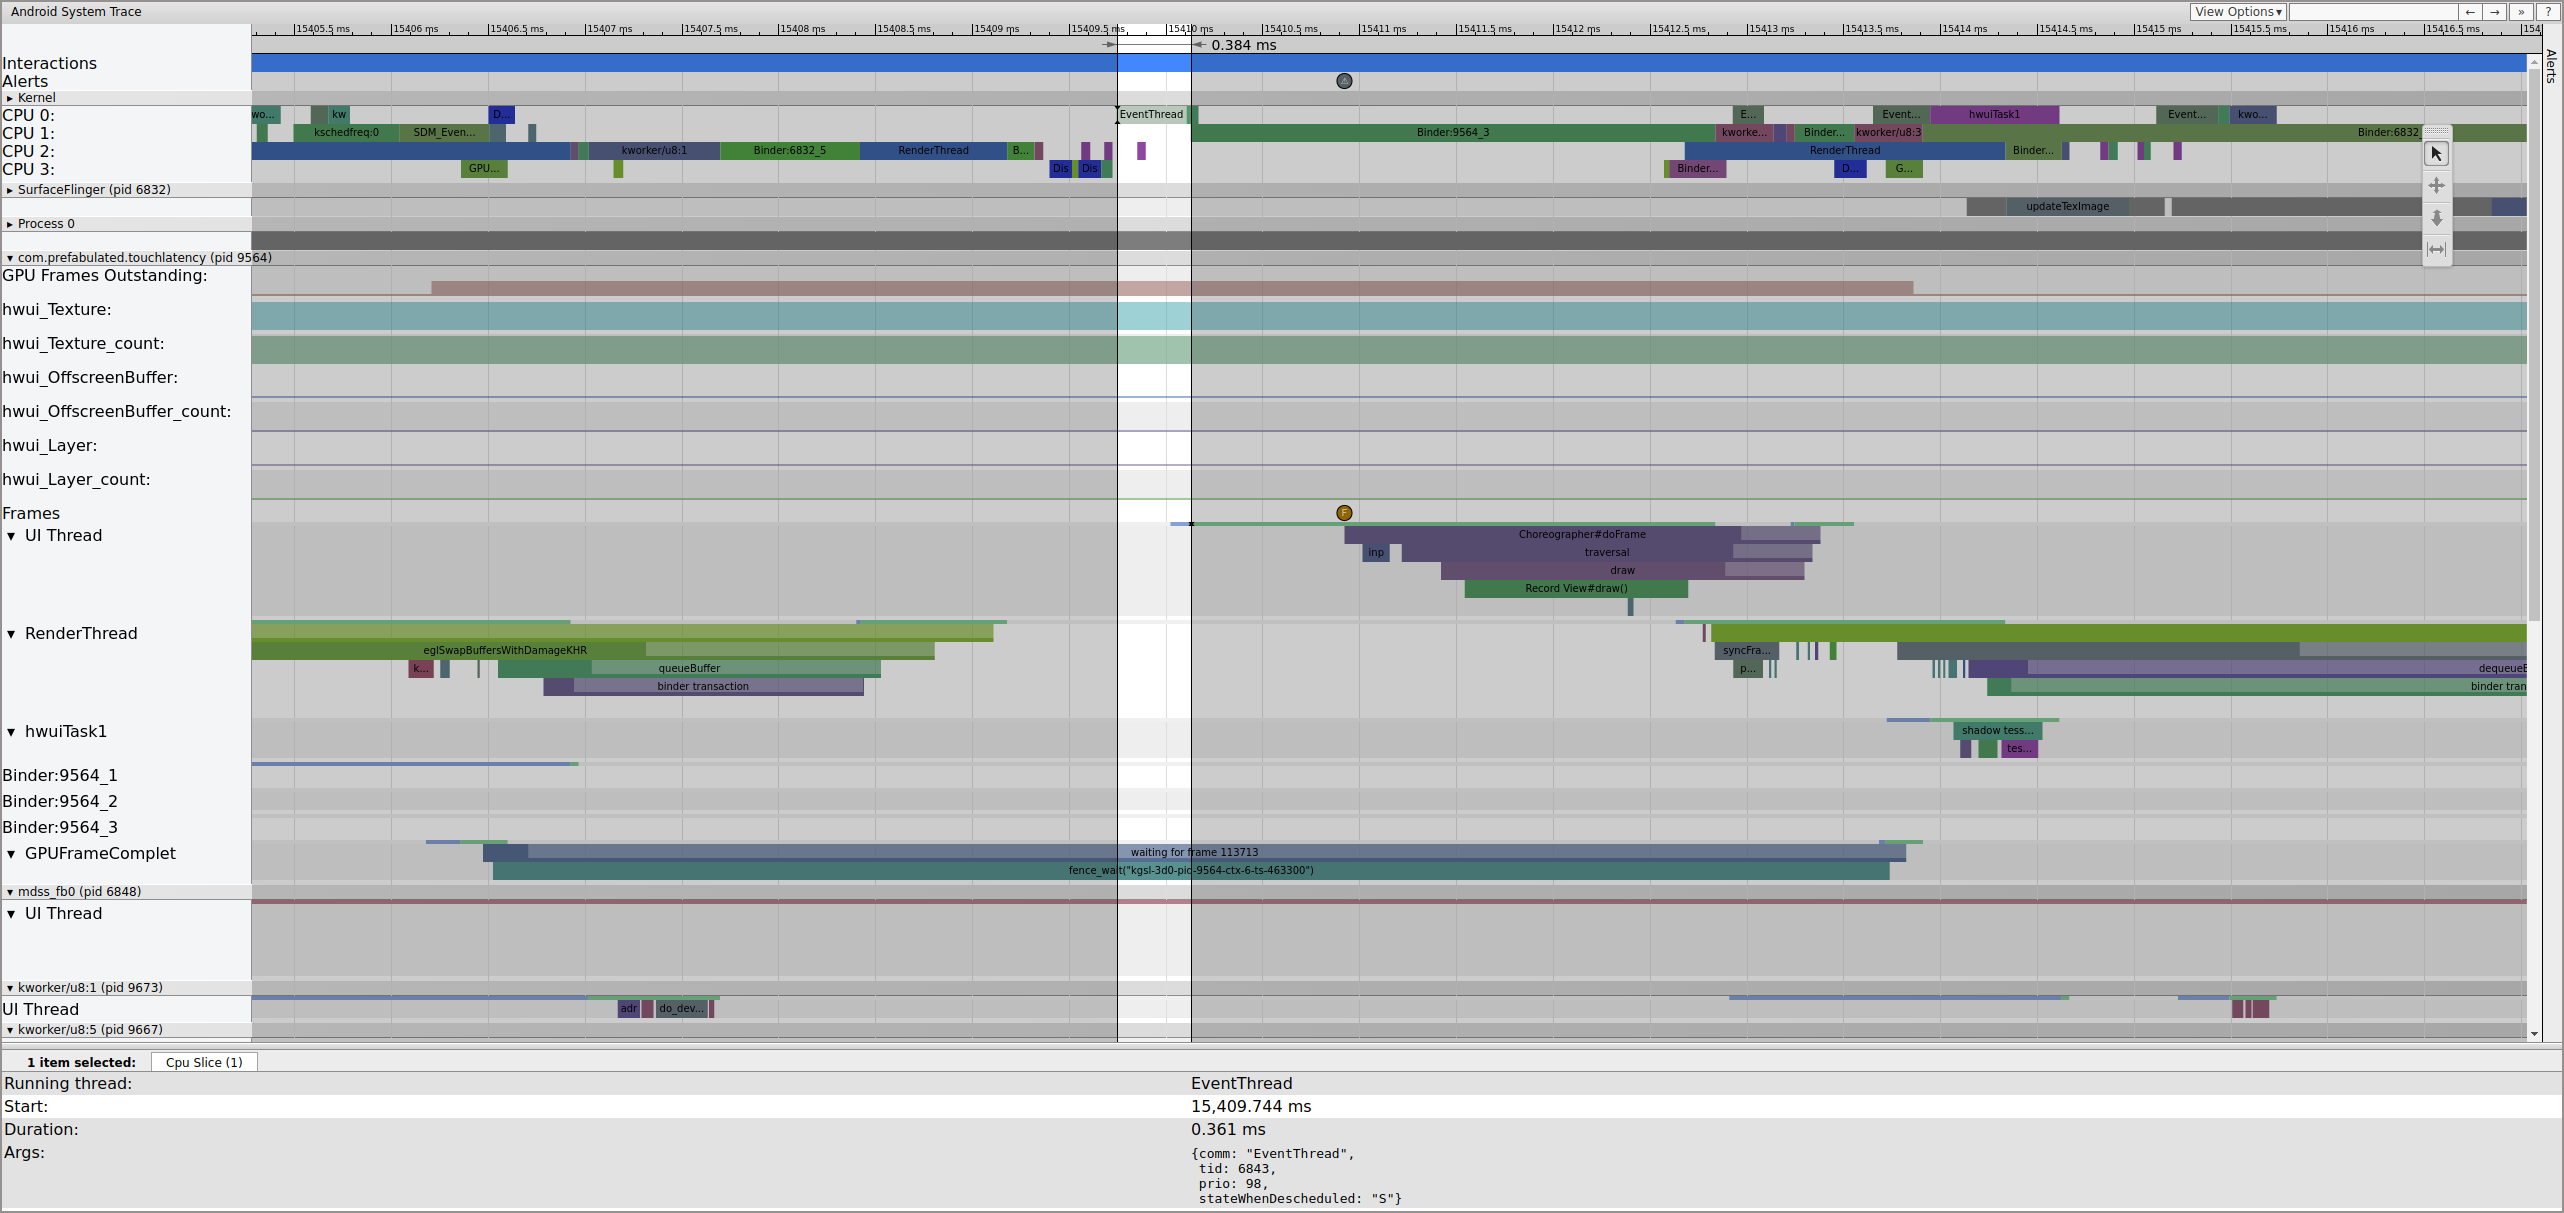
Figure 1. Normal UI pipeline, EventThread running.
Figure 1 is a normal frame surrounded by normal frames, so it's a good starting point for understanding how the UI pipeline works. The UI thread row for TouchLatency includes different colors at different times. Bars denote different states for the thread:
- Gray. Sleeping.
- Blue. Runnable (it could run, but the scheduler hasn't picked it to run yet).
- Green. Actively running (the scheduler thinks it's running).
- Red. Uninterruptible sleep (generally sleeping on a lock in the kernel). Can be indicative of I/O load. Extremely useful for debugging performance issues.
- Orange. Uninterruptible sleep due to I/O load.
To view the reason for uninterruptible sleep (available from the
sched_blocked_reason tracepoint), select the red uninterruptible
sleep slice.
While EventThread is running, the UI thread for TouchLatency becomes runnable. To see what woke it, click the blue section.
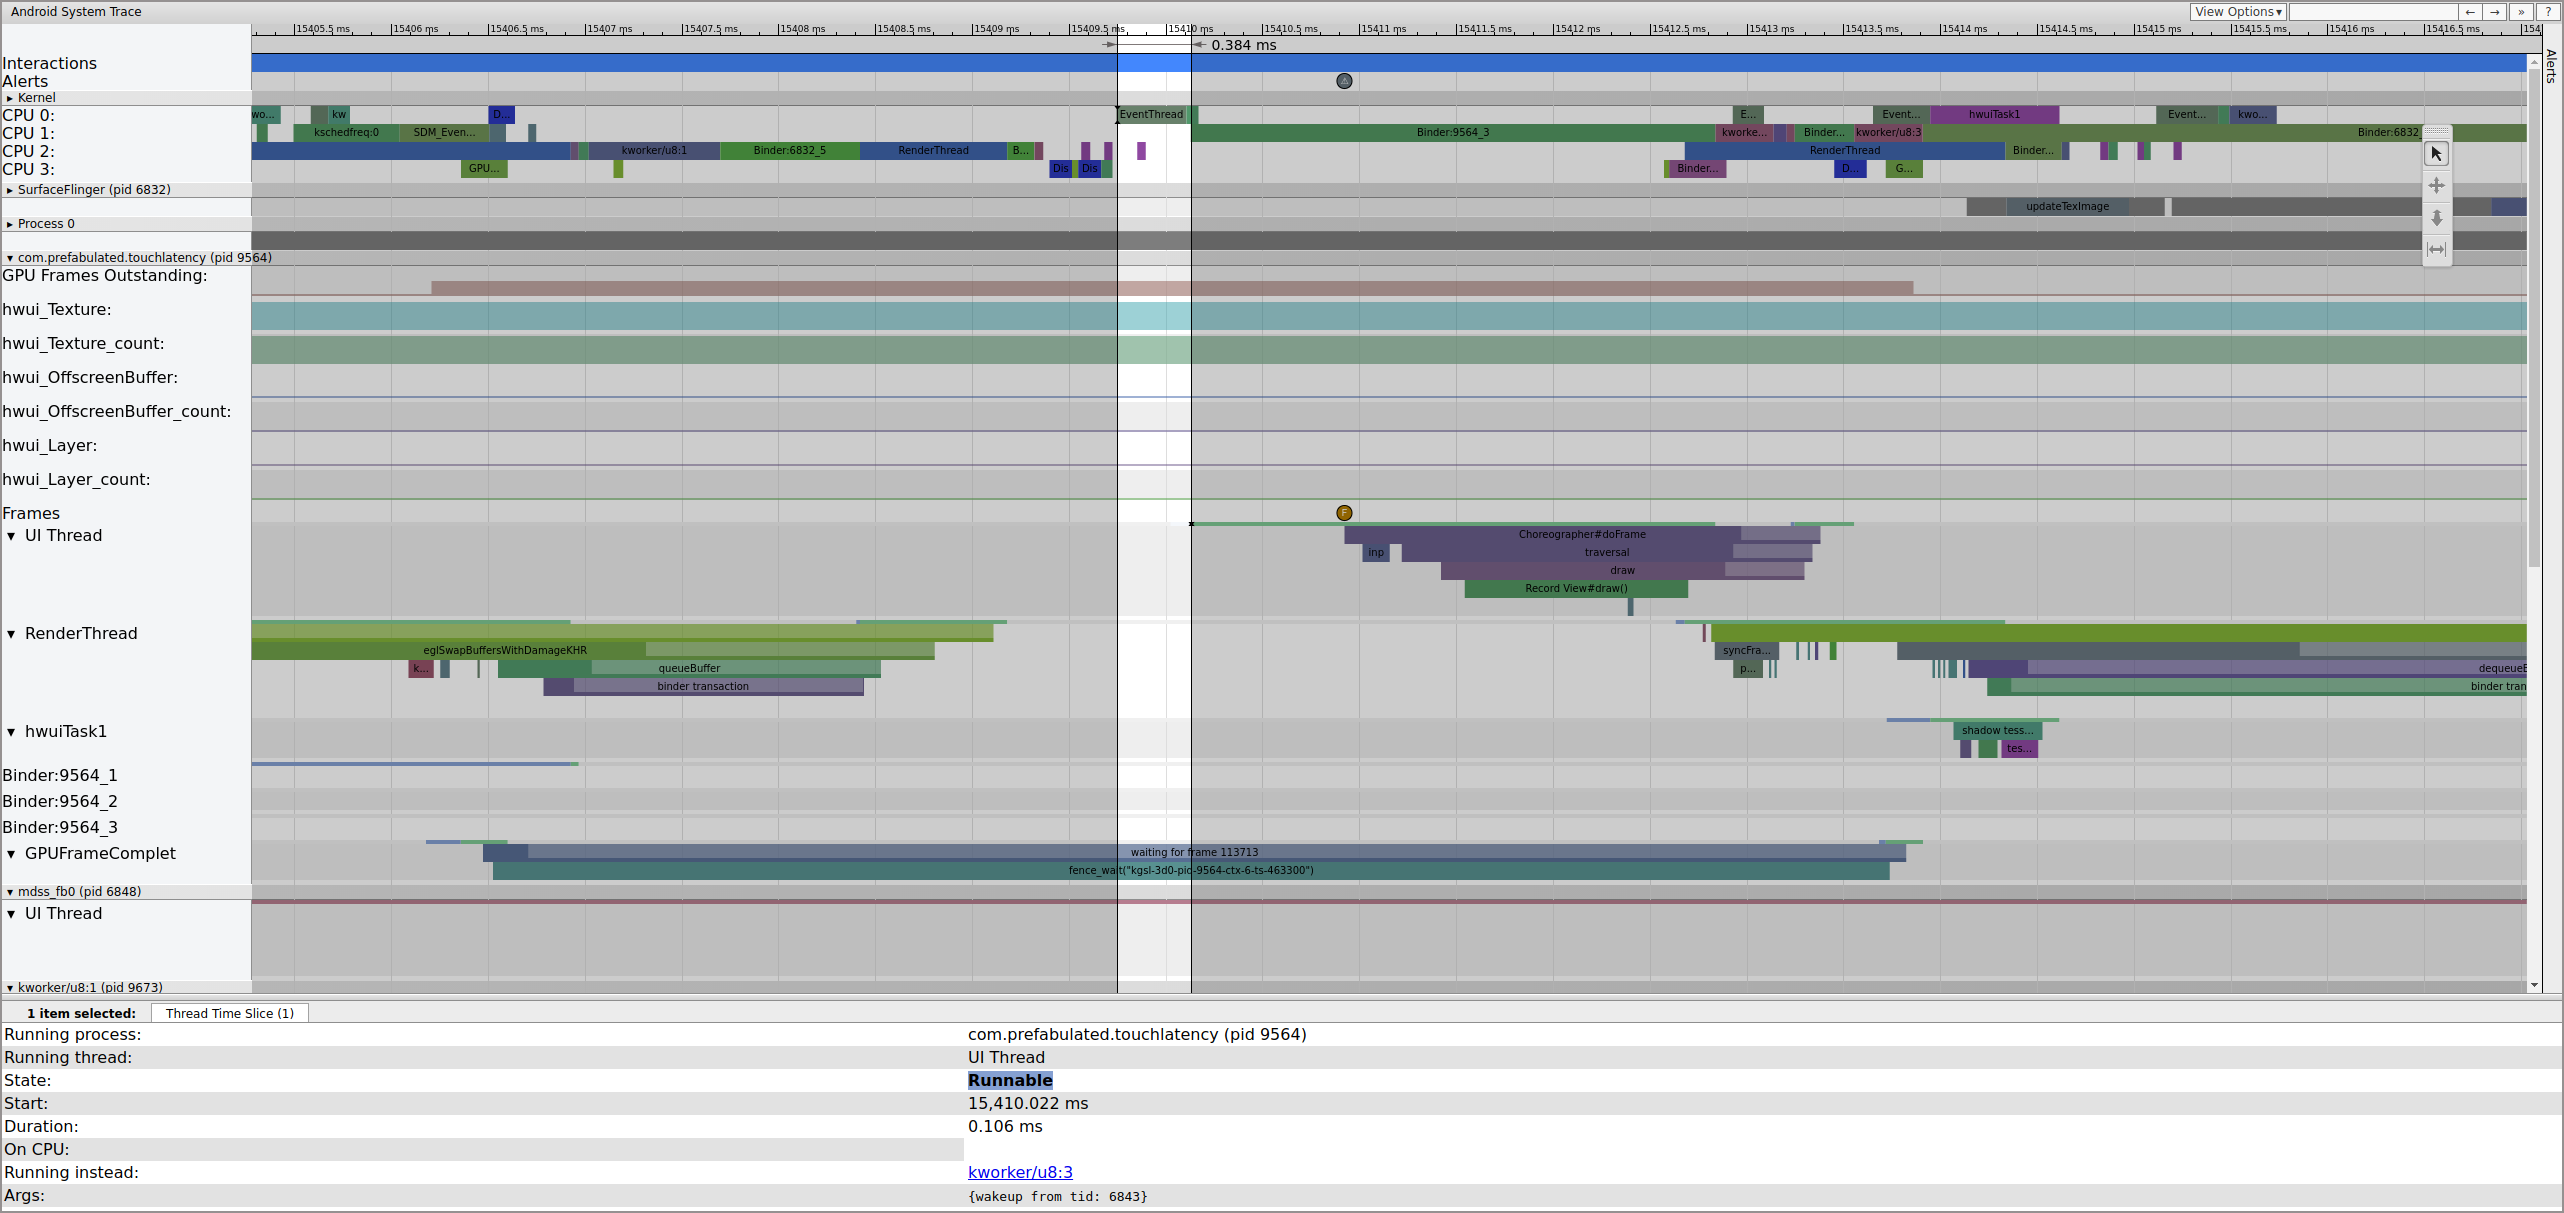
Figure 2. UI thread for TouchLatency.
Figure 2 shows the TouchLatency UI thread was woken by tid 6843, which corresponds to EventThread. The UI thread wakes, renders a frame, and enqueues it for SurfaceFlinger to consume.
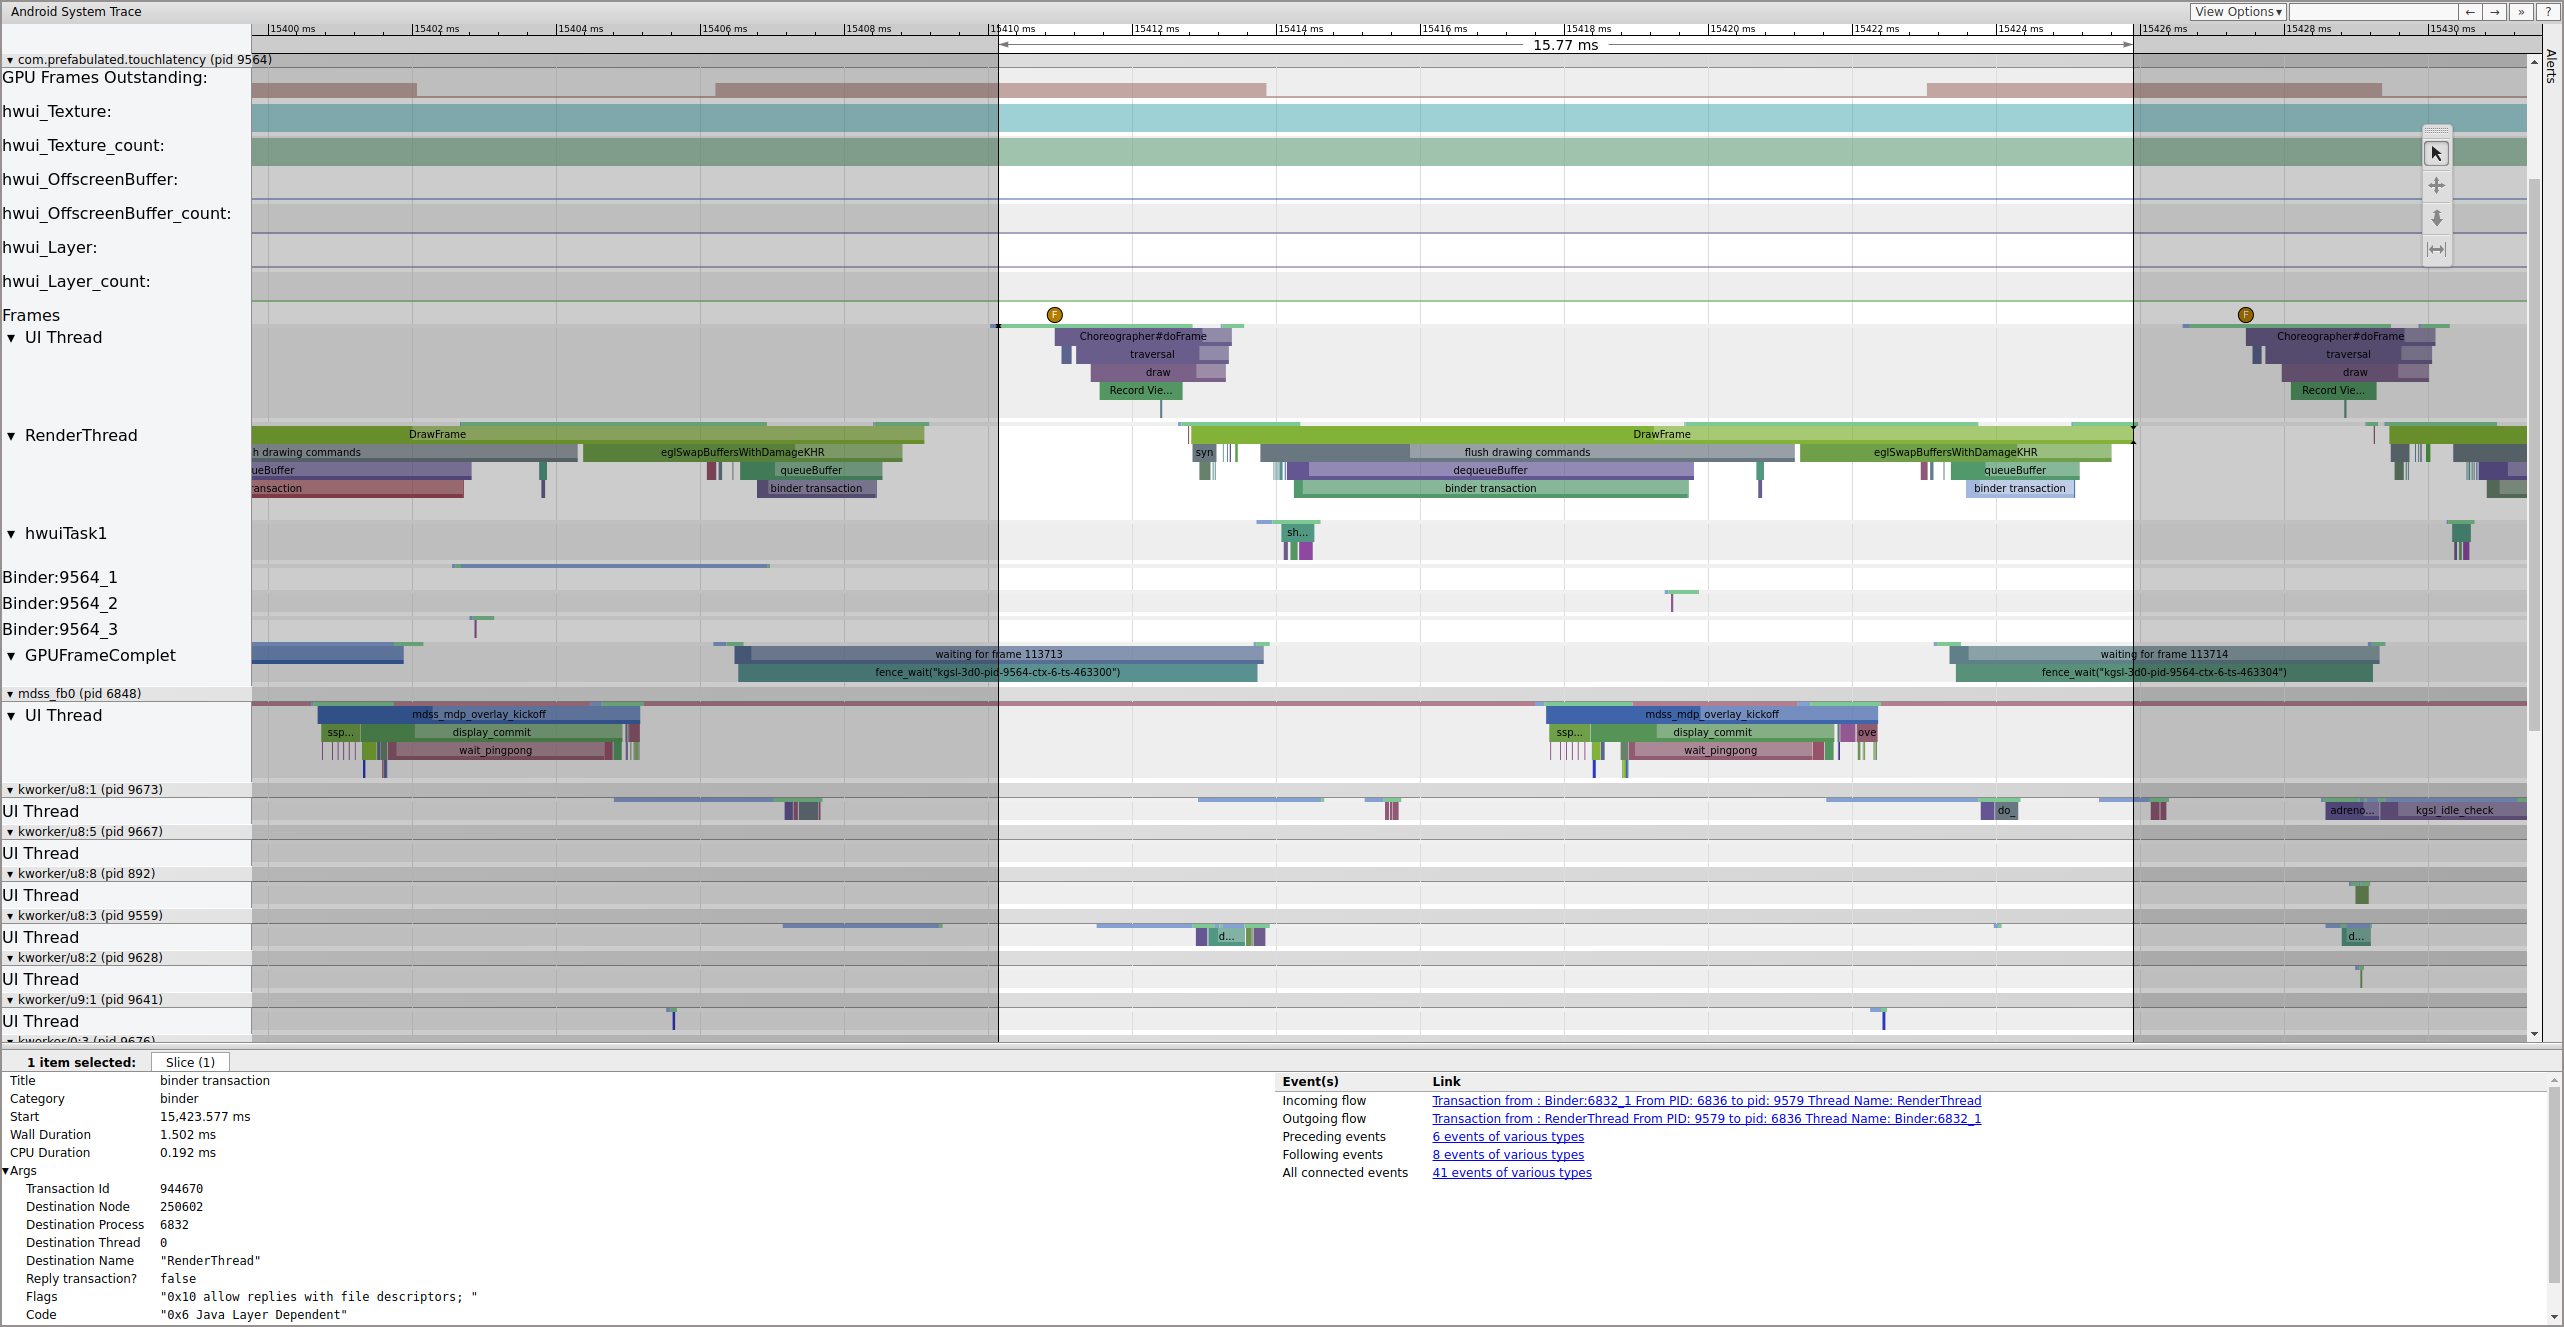
Figure 3. UI thread wakes, renders a frame, and enqueues it for SurfaceFlinger to consume.
If the binder_driver tag is enabled in a trace, you can select a
binder transaction to view information on all of the processes involved in that
transaction.
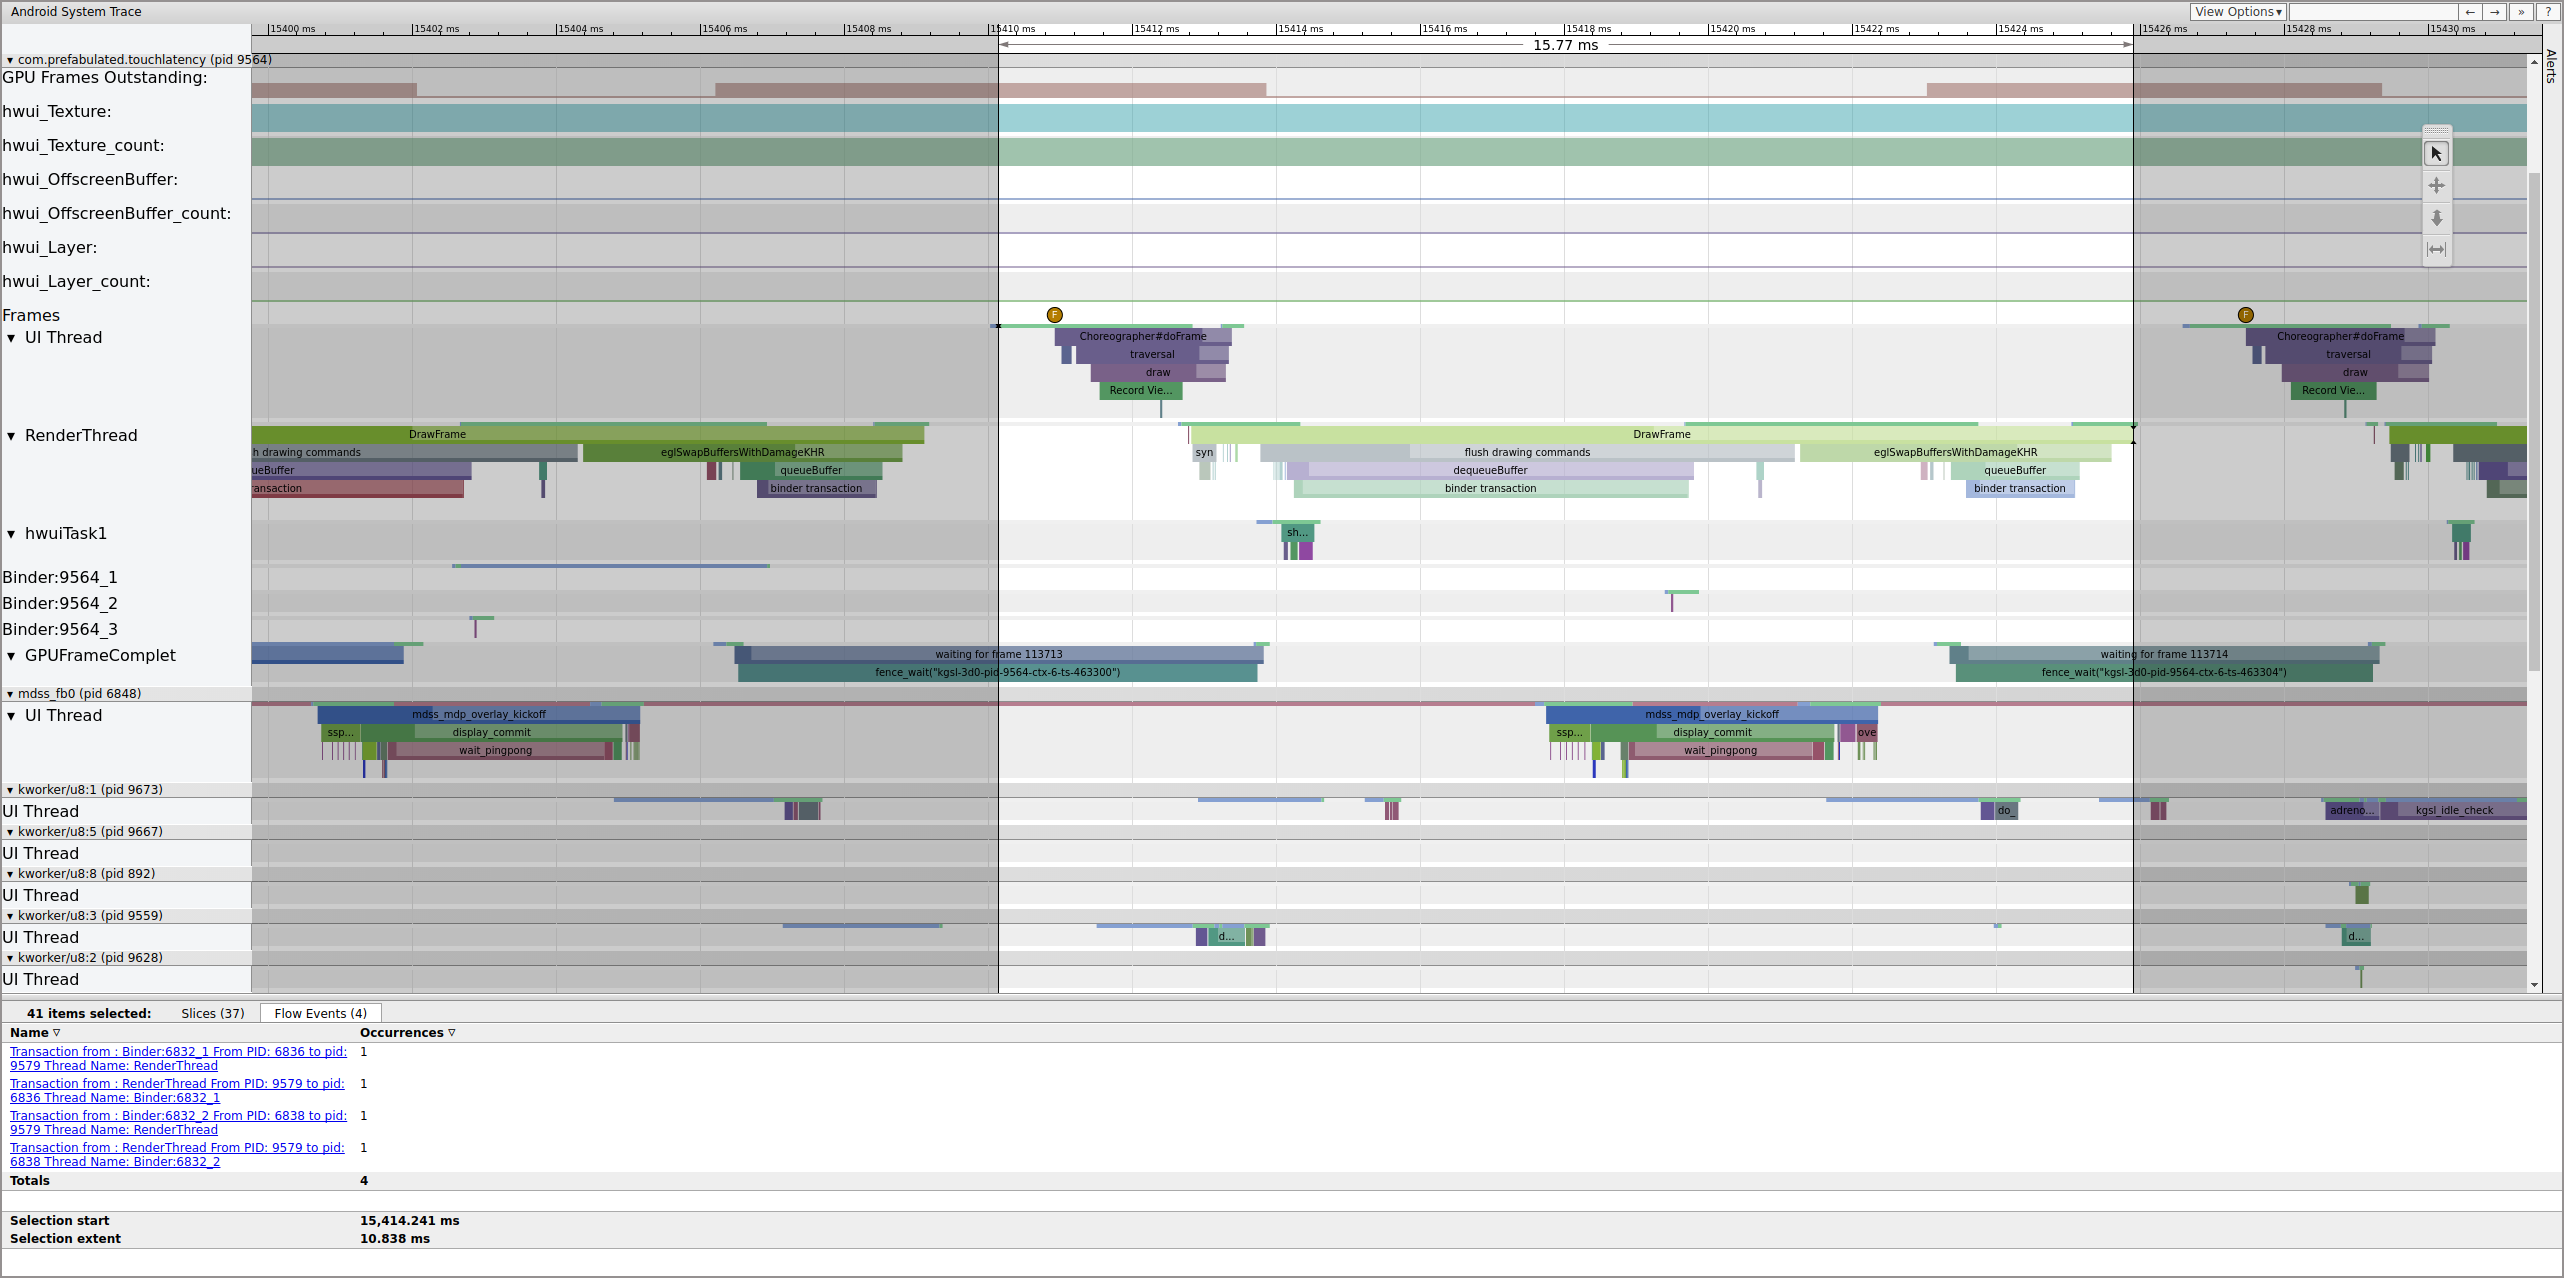
Figure 4. Binder transaction.
Figure 4 shows that, at 15,423.65 ms Binder:6832_1 in SurfaceFlinger becomes runnable because of tid 9579, which is TouchLatency's RenderThread. You can also see queueBuffer on both sides of the binder transaction.
During the queueBuffer on the SurfaceFlinger side, the number of pending frames from TouchLatency goes from 1 to 2.
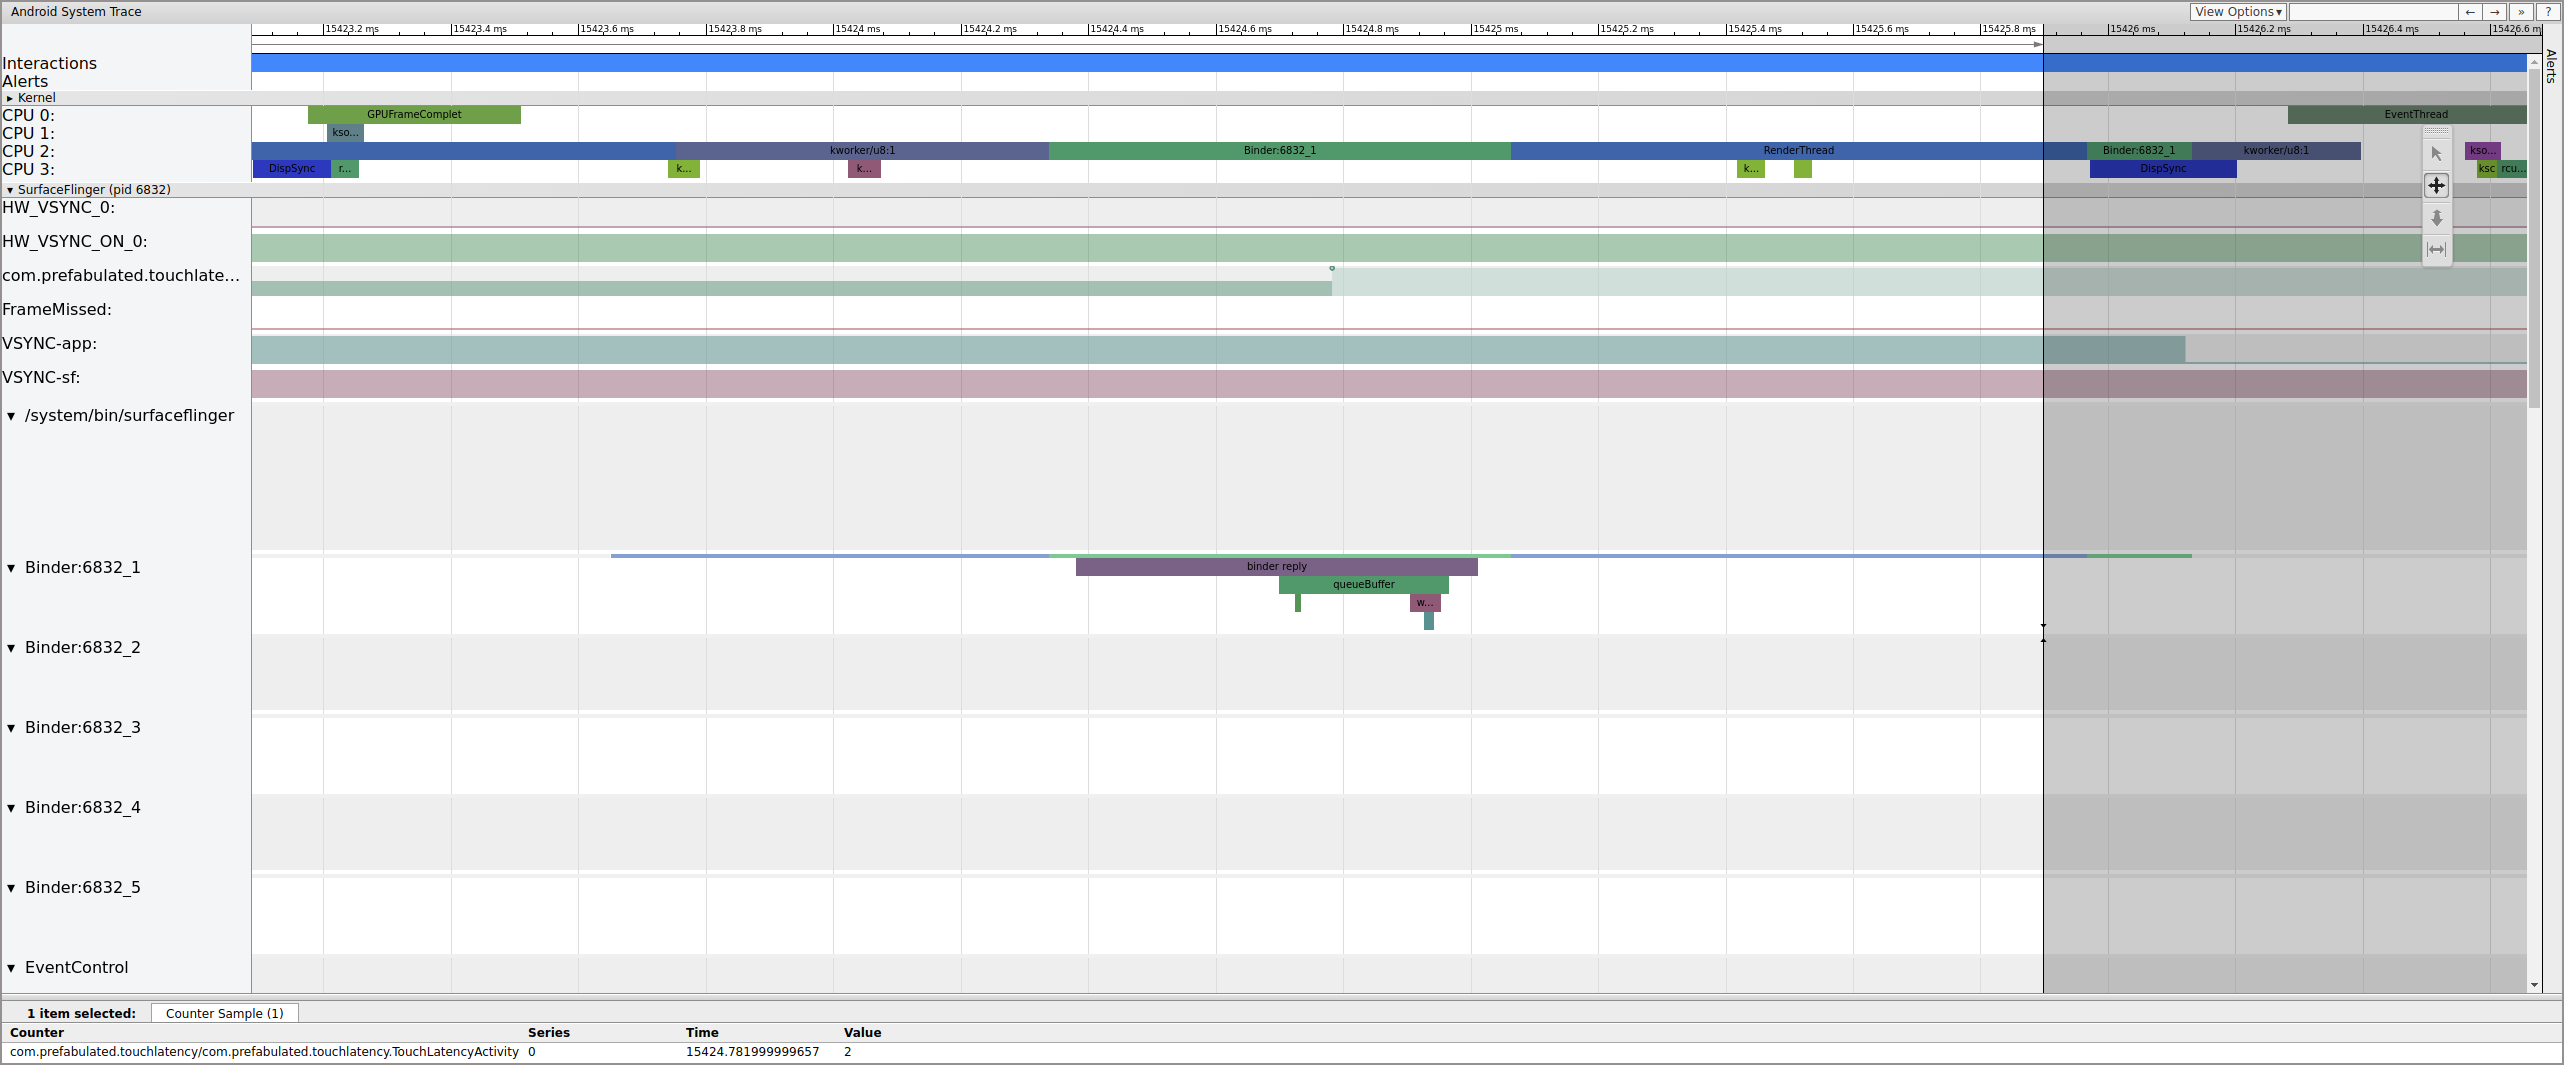
Figure 5. Pending frames go from 1 to 2.
Figure 5 shows triple buffering, where there are two completed frames and the app is about to start rendering a third. This is because we've already dropped some frames, so the app keeps two pending frames instead of one to try to avoid further dropped frames.
Soon after, SurfaceFlinger's main thread is woken by a second EventThread so it can output the older pending frame to the display:
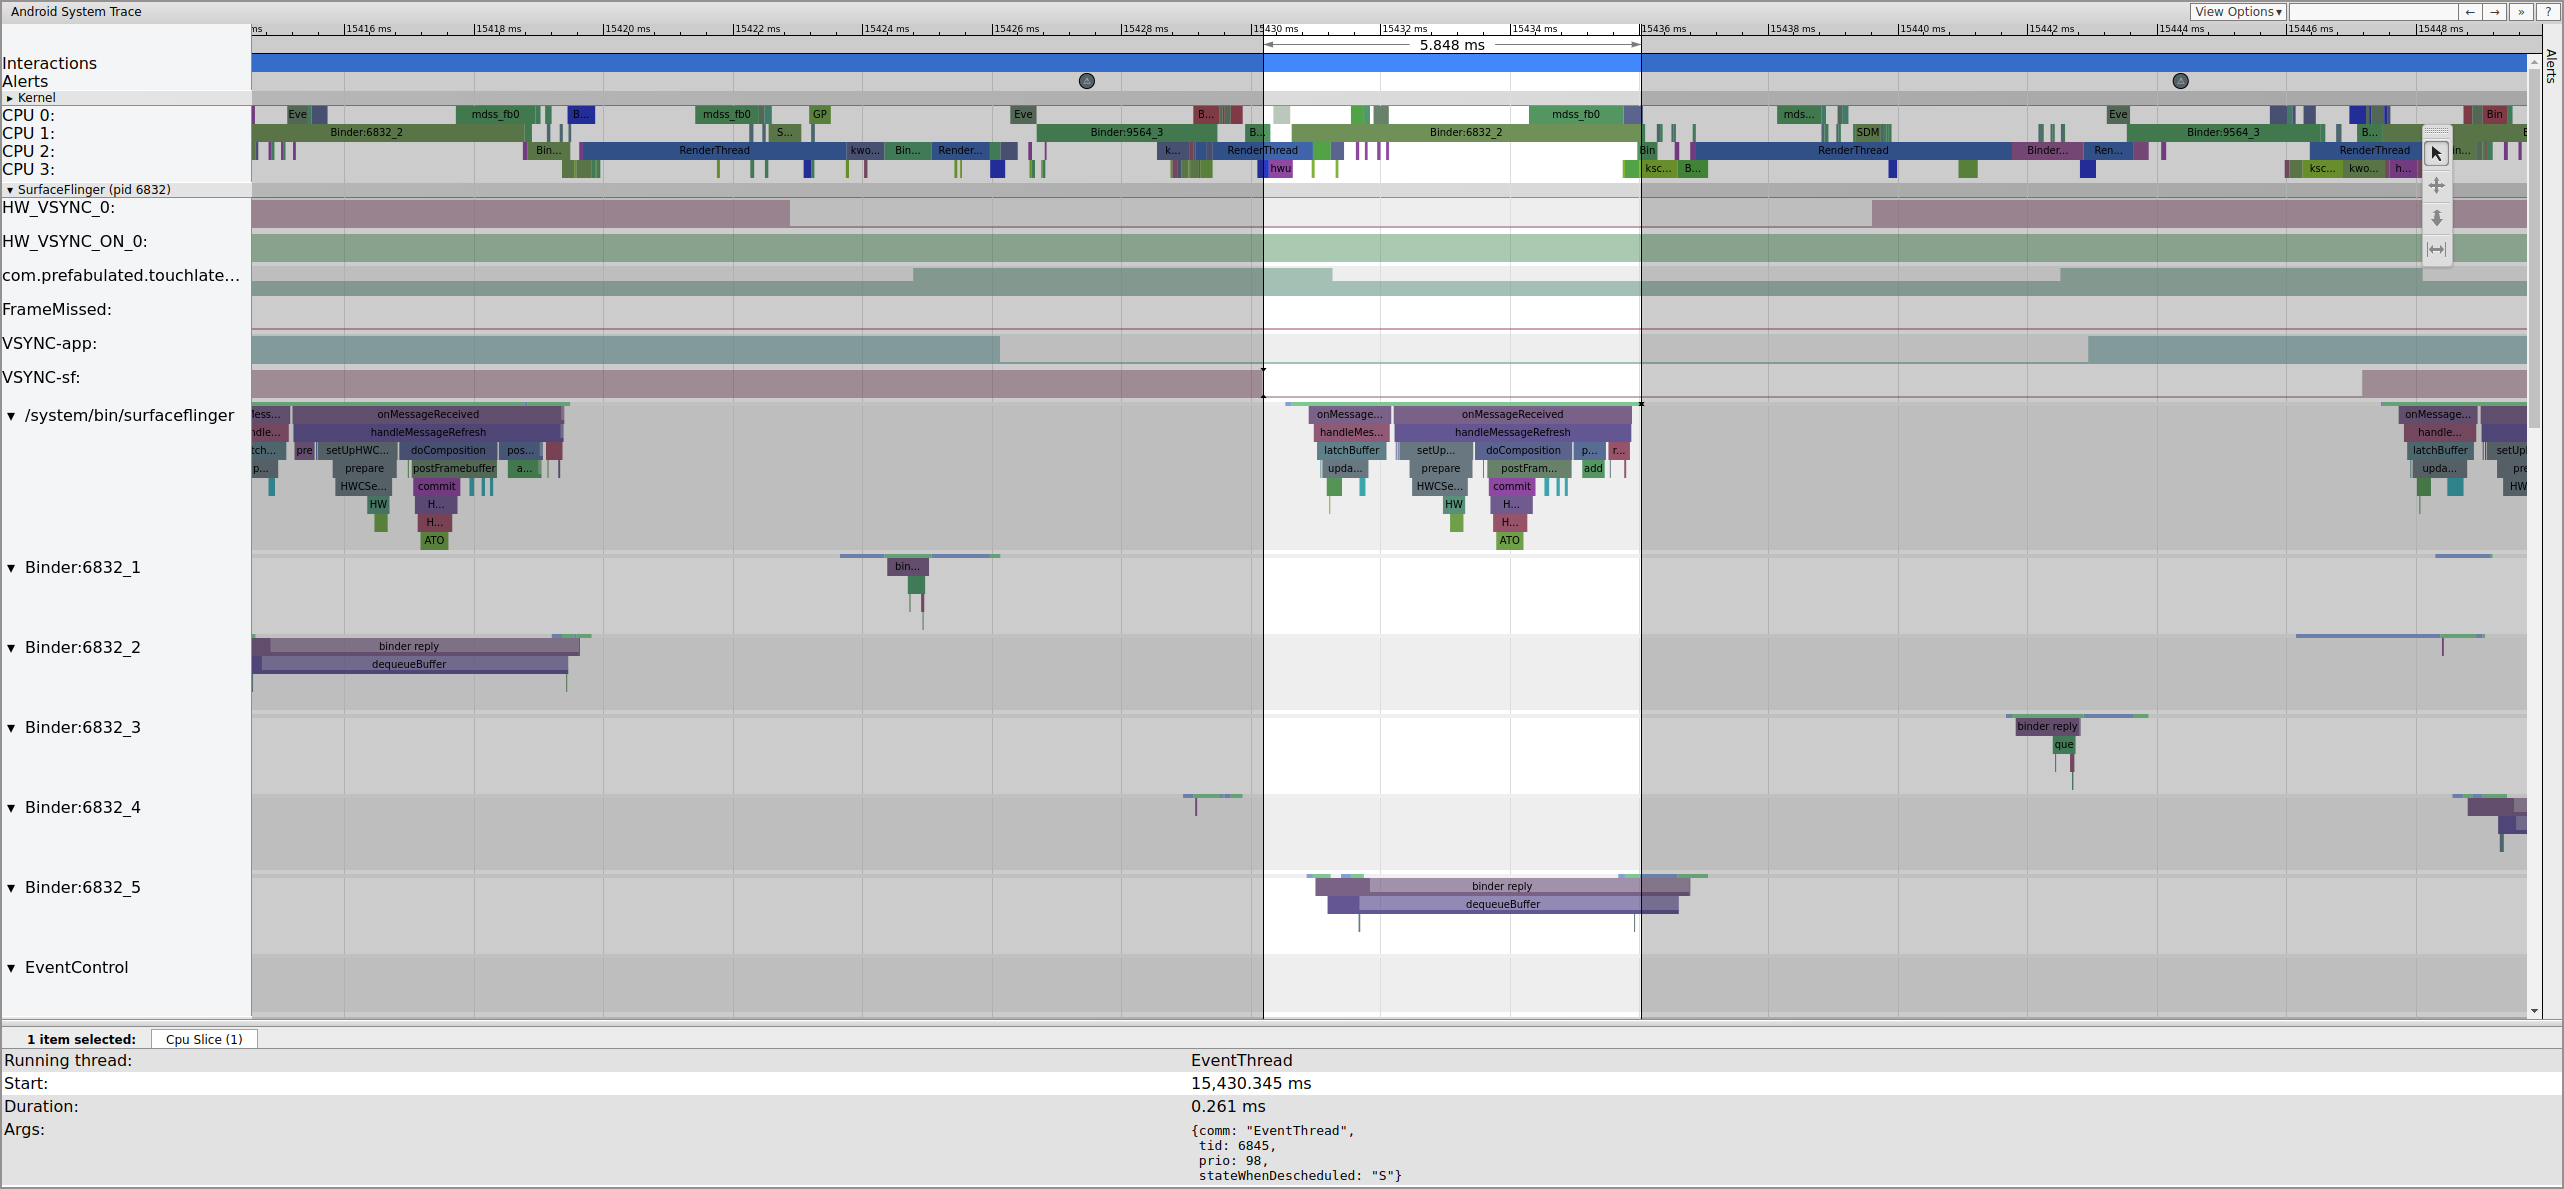
Figure 6. SurfaceFlinger's main thread is woken by a second EventThread.
SurfaceFlinger first latches the older pending buffer, which causes the pending buffer count to decrease from 2 to 1:
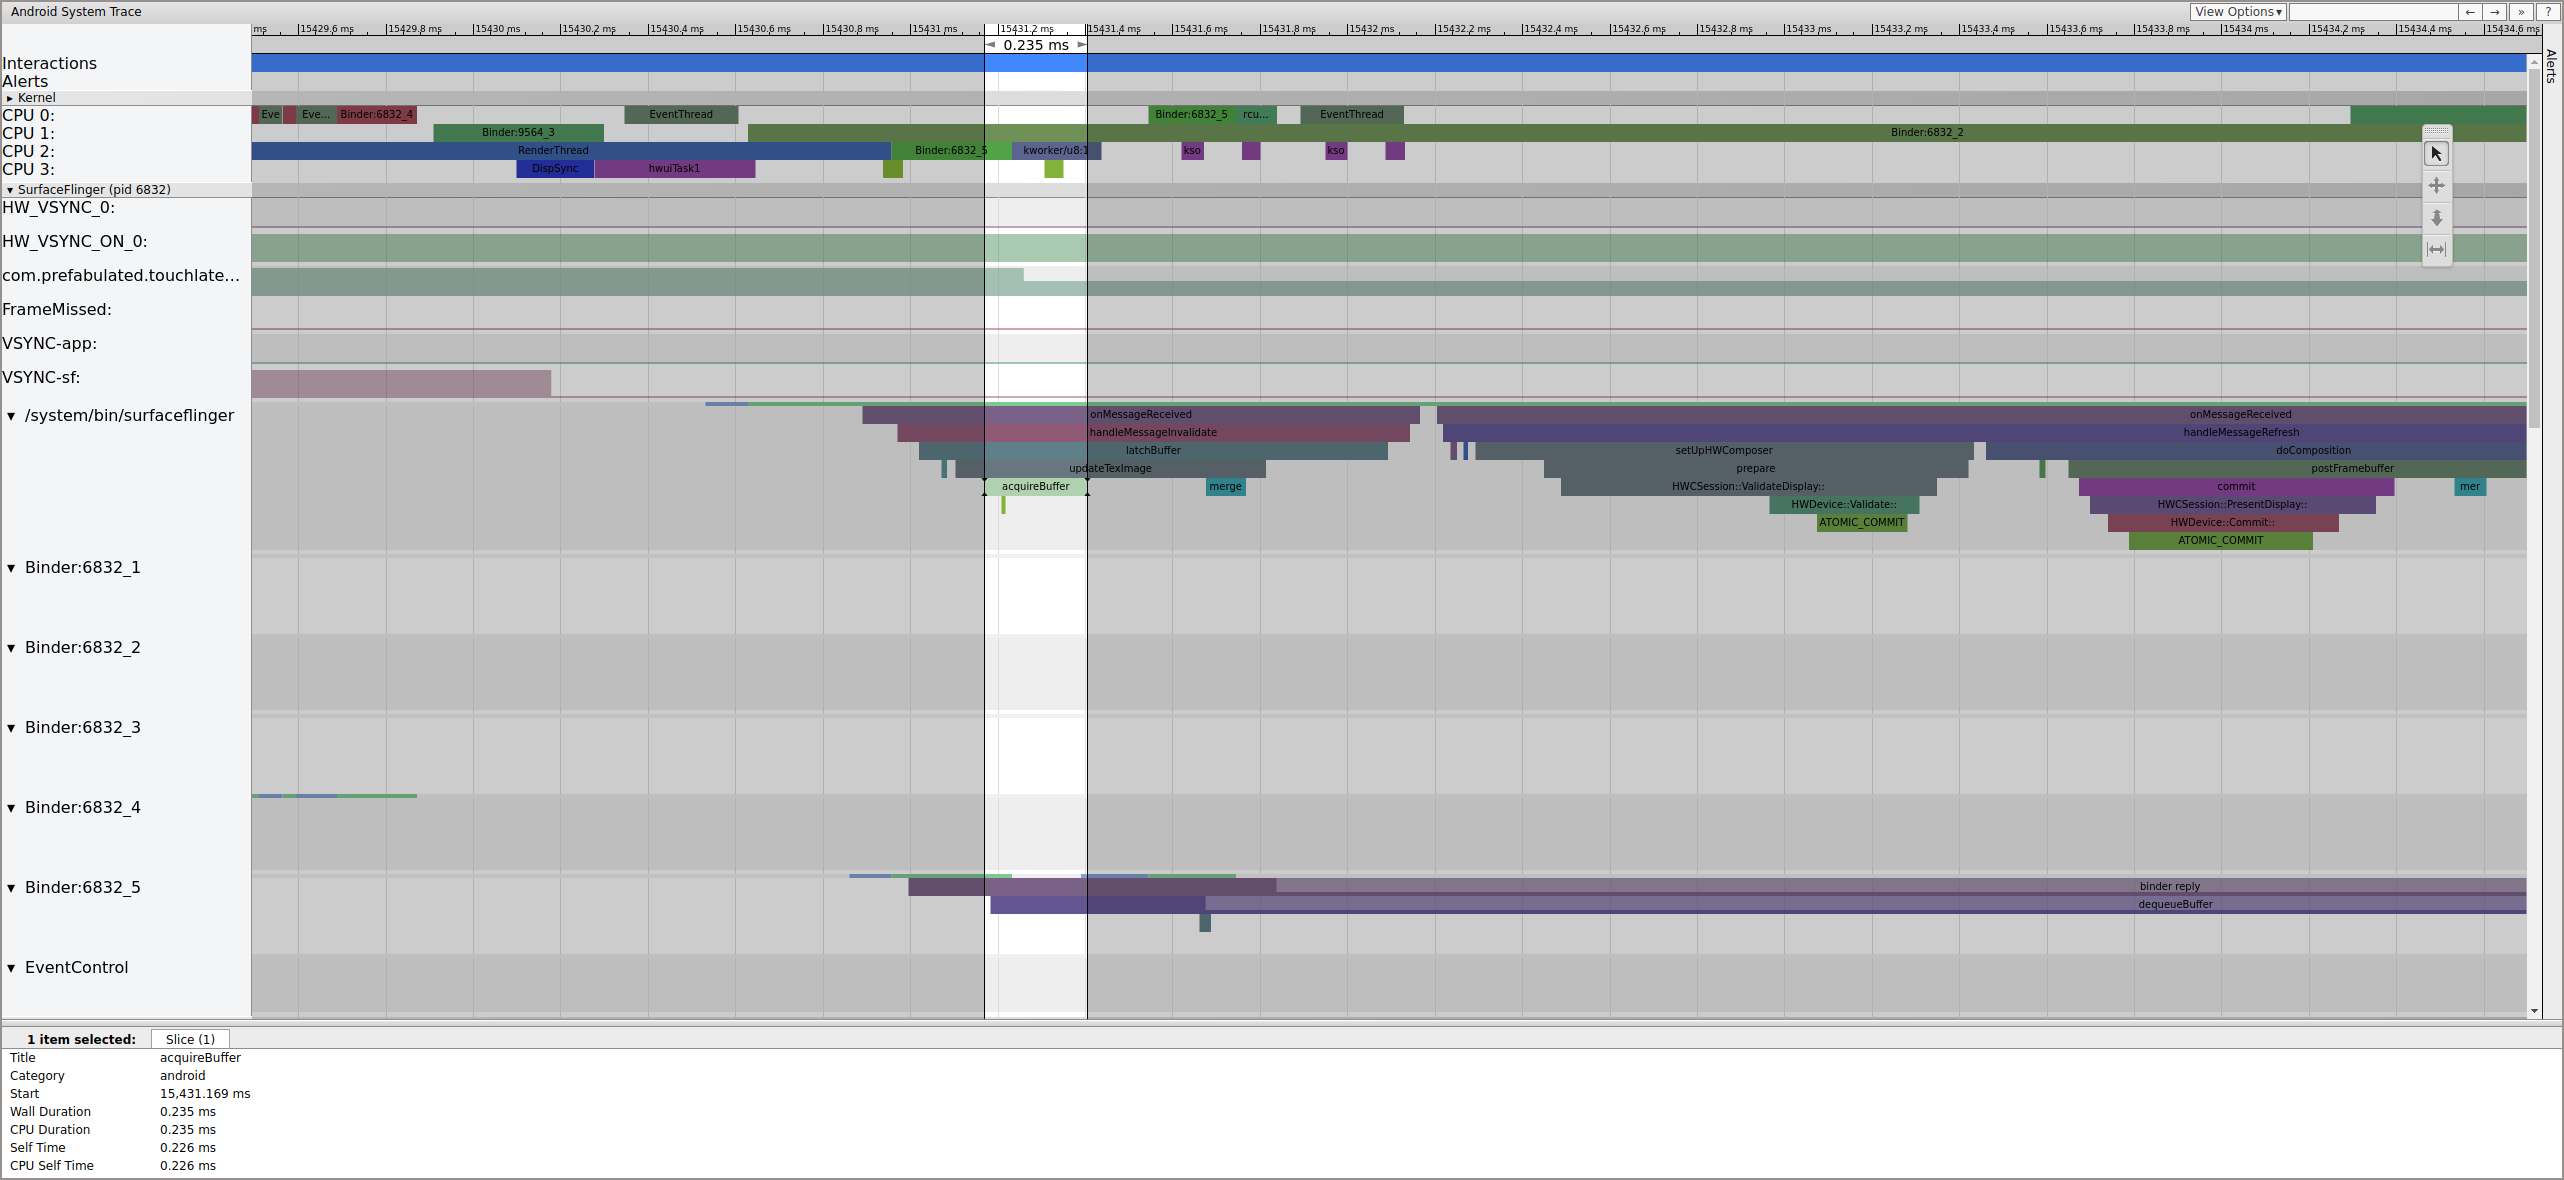
Figure 7. SurfaceFlinger first latches onto the older pending buffer.
After latching the buffer, SurfaceFlinger sets up composition and submits the
final frame to the display. (Some of these sections are enabled as part of the
mdss tracepoint, so they might not be included on your SoC.)
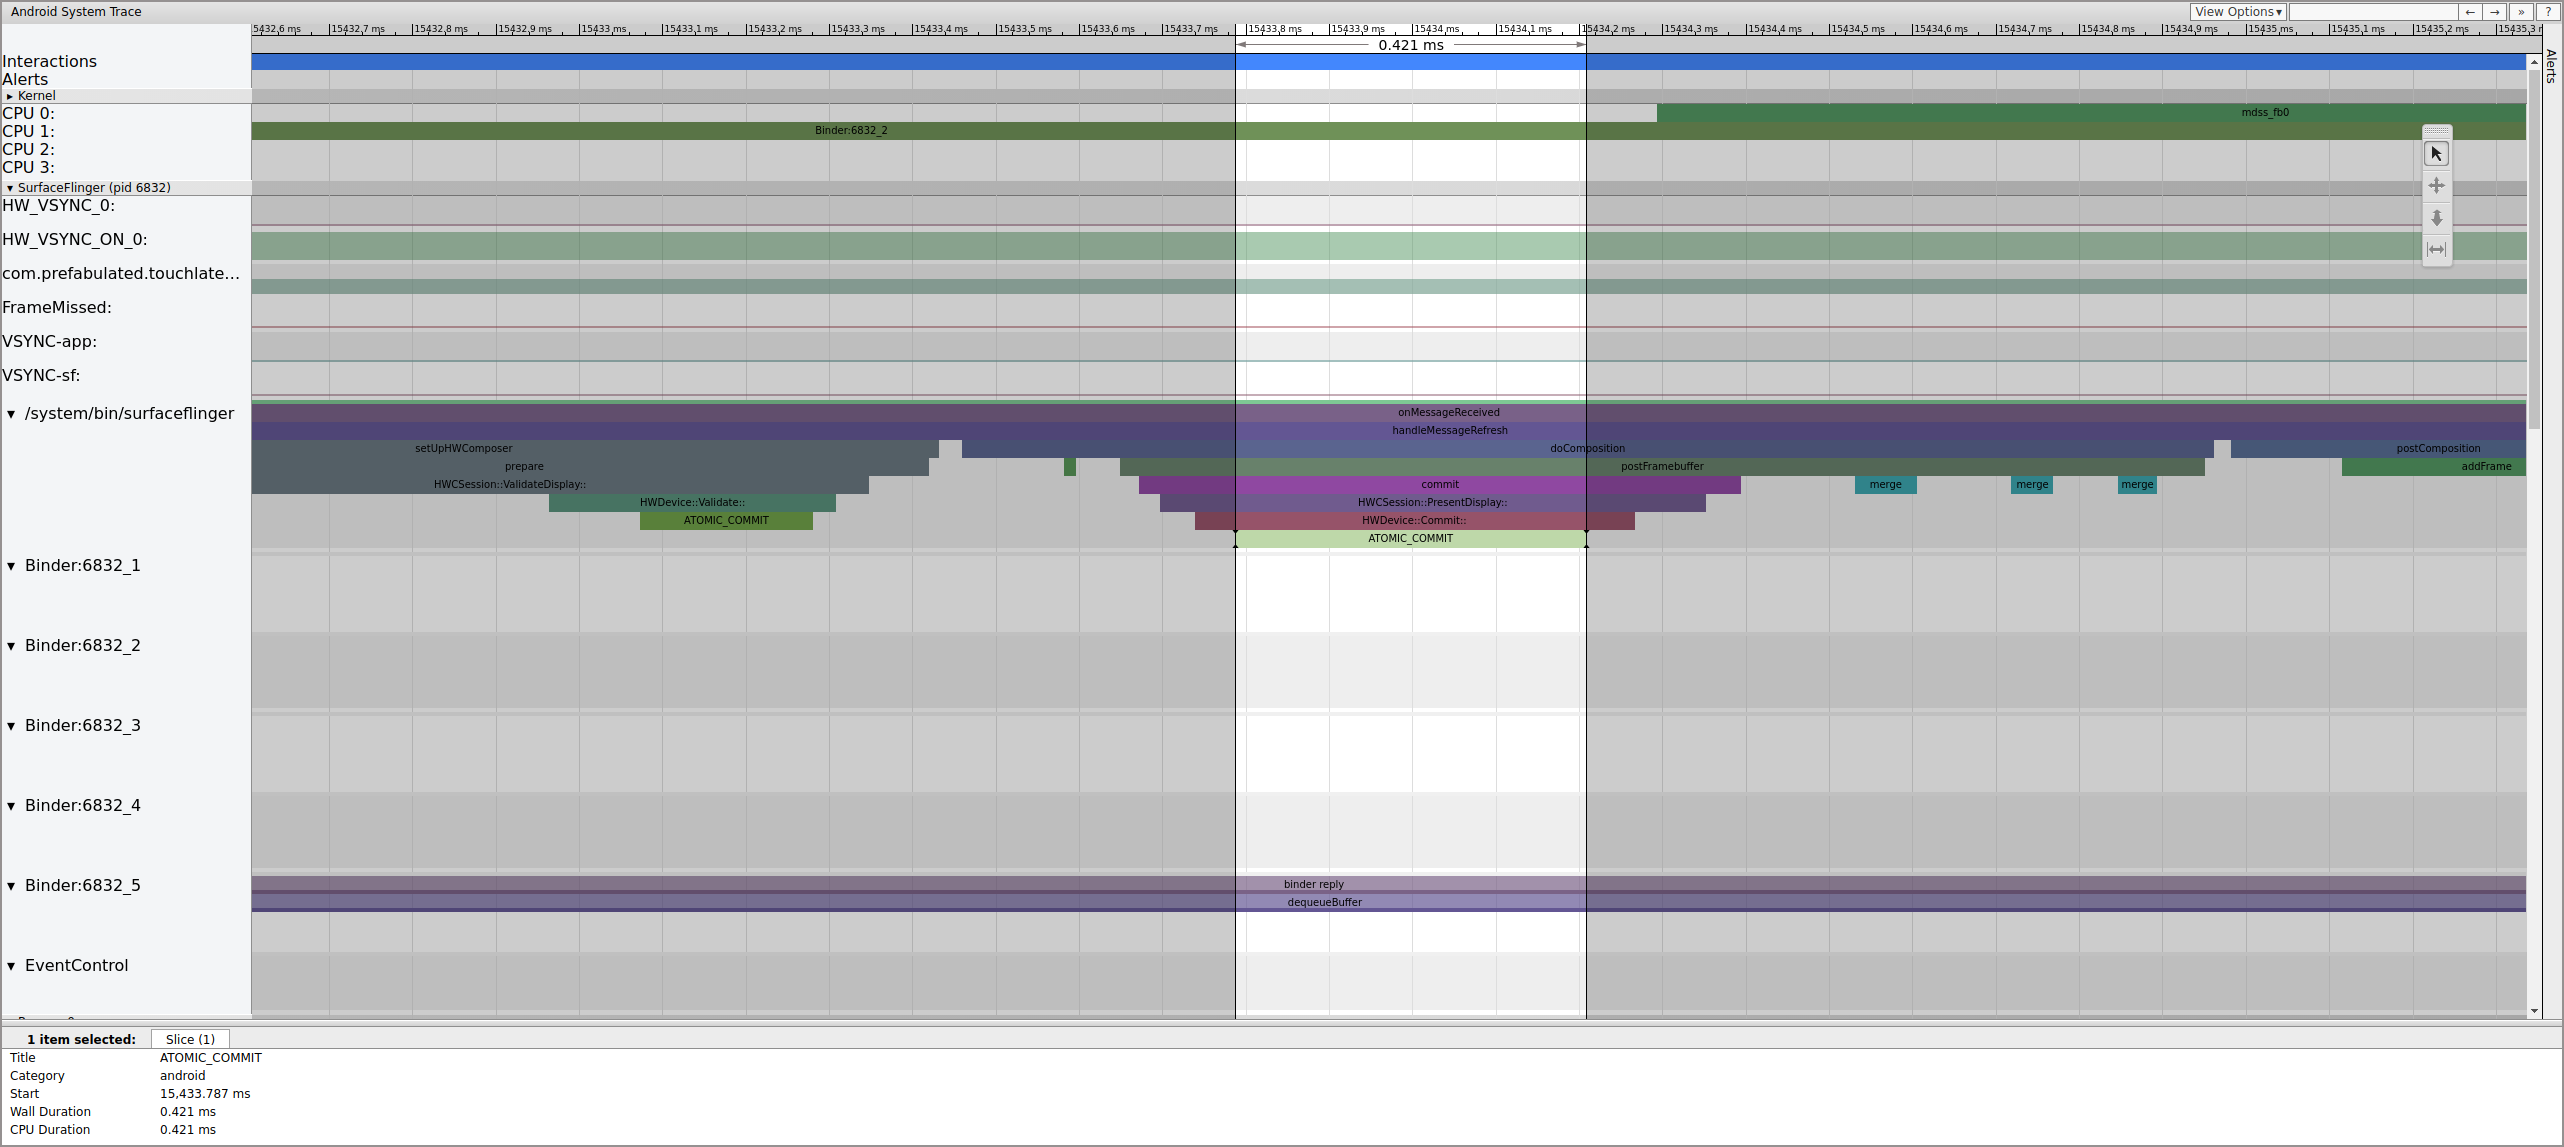
Figure 8. SurfaceFlinger sets up composition and submits the final frame.
Next, mdss_fb0 wakes on CPU 0. mdss_fb0 is the
display pipeline's kernel thread for outputting a rendered frame to the display.
Notice that mdss_fb0 is its own row in the trace (scroll down to
view):
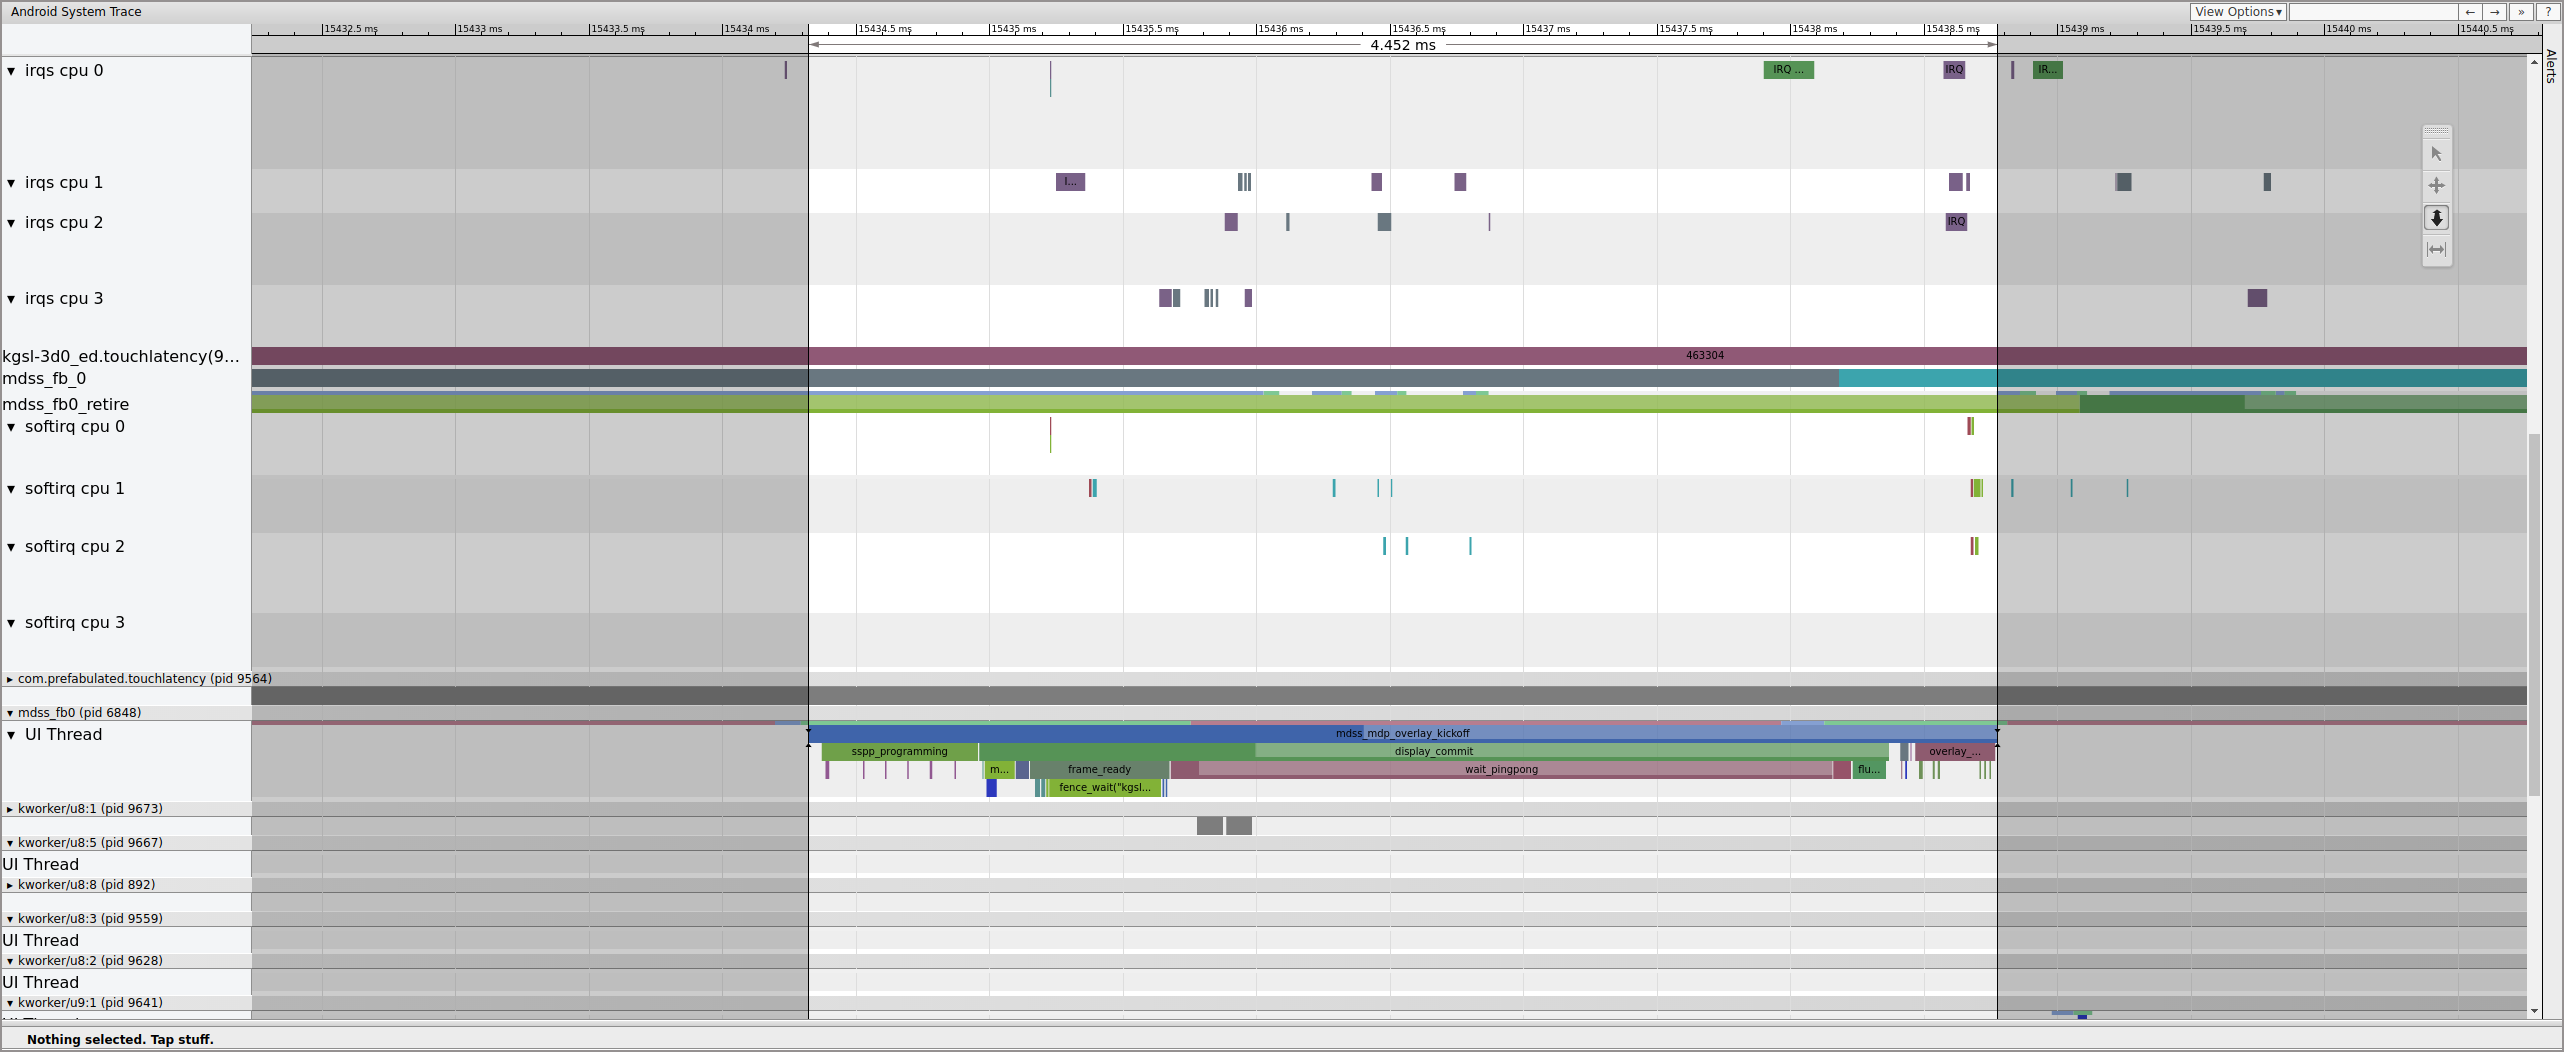
Figure 9. mdss_fb0 wakes on CPU 0.
mdss_fb0 wakes up, runs briefly, enters uninterruptible sleep,
then wakes again.
Example: Nonworking frame
This example describes a systrace used to debug Pixel or Pixel XL jitter. To
follow along with the example, download the zip
file of traces (which includes other traces referred to in this
section), unzip the file, and open the systrace_tutorial.html file in your
browser.
When you open the systrace, you see something like the following figure:
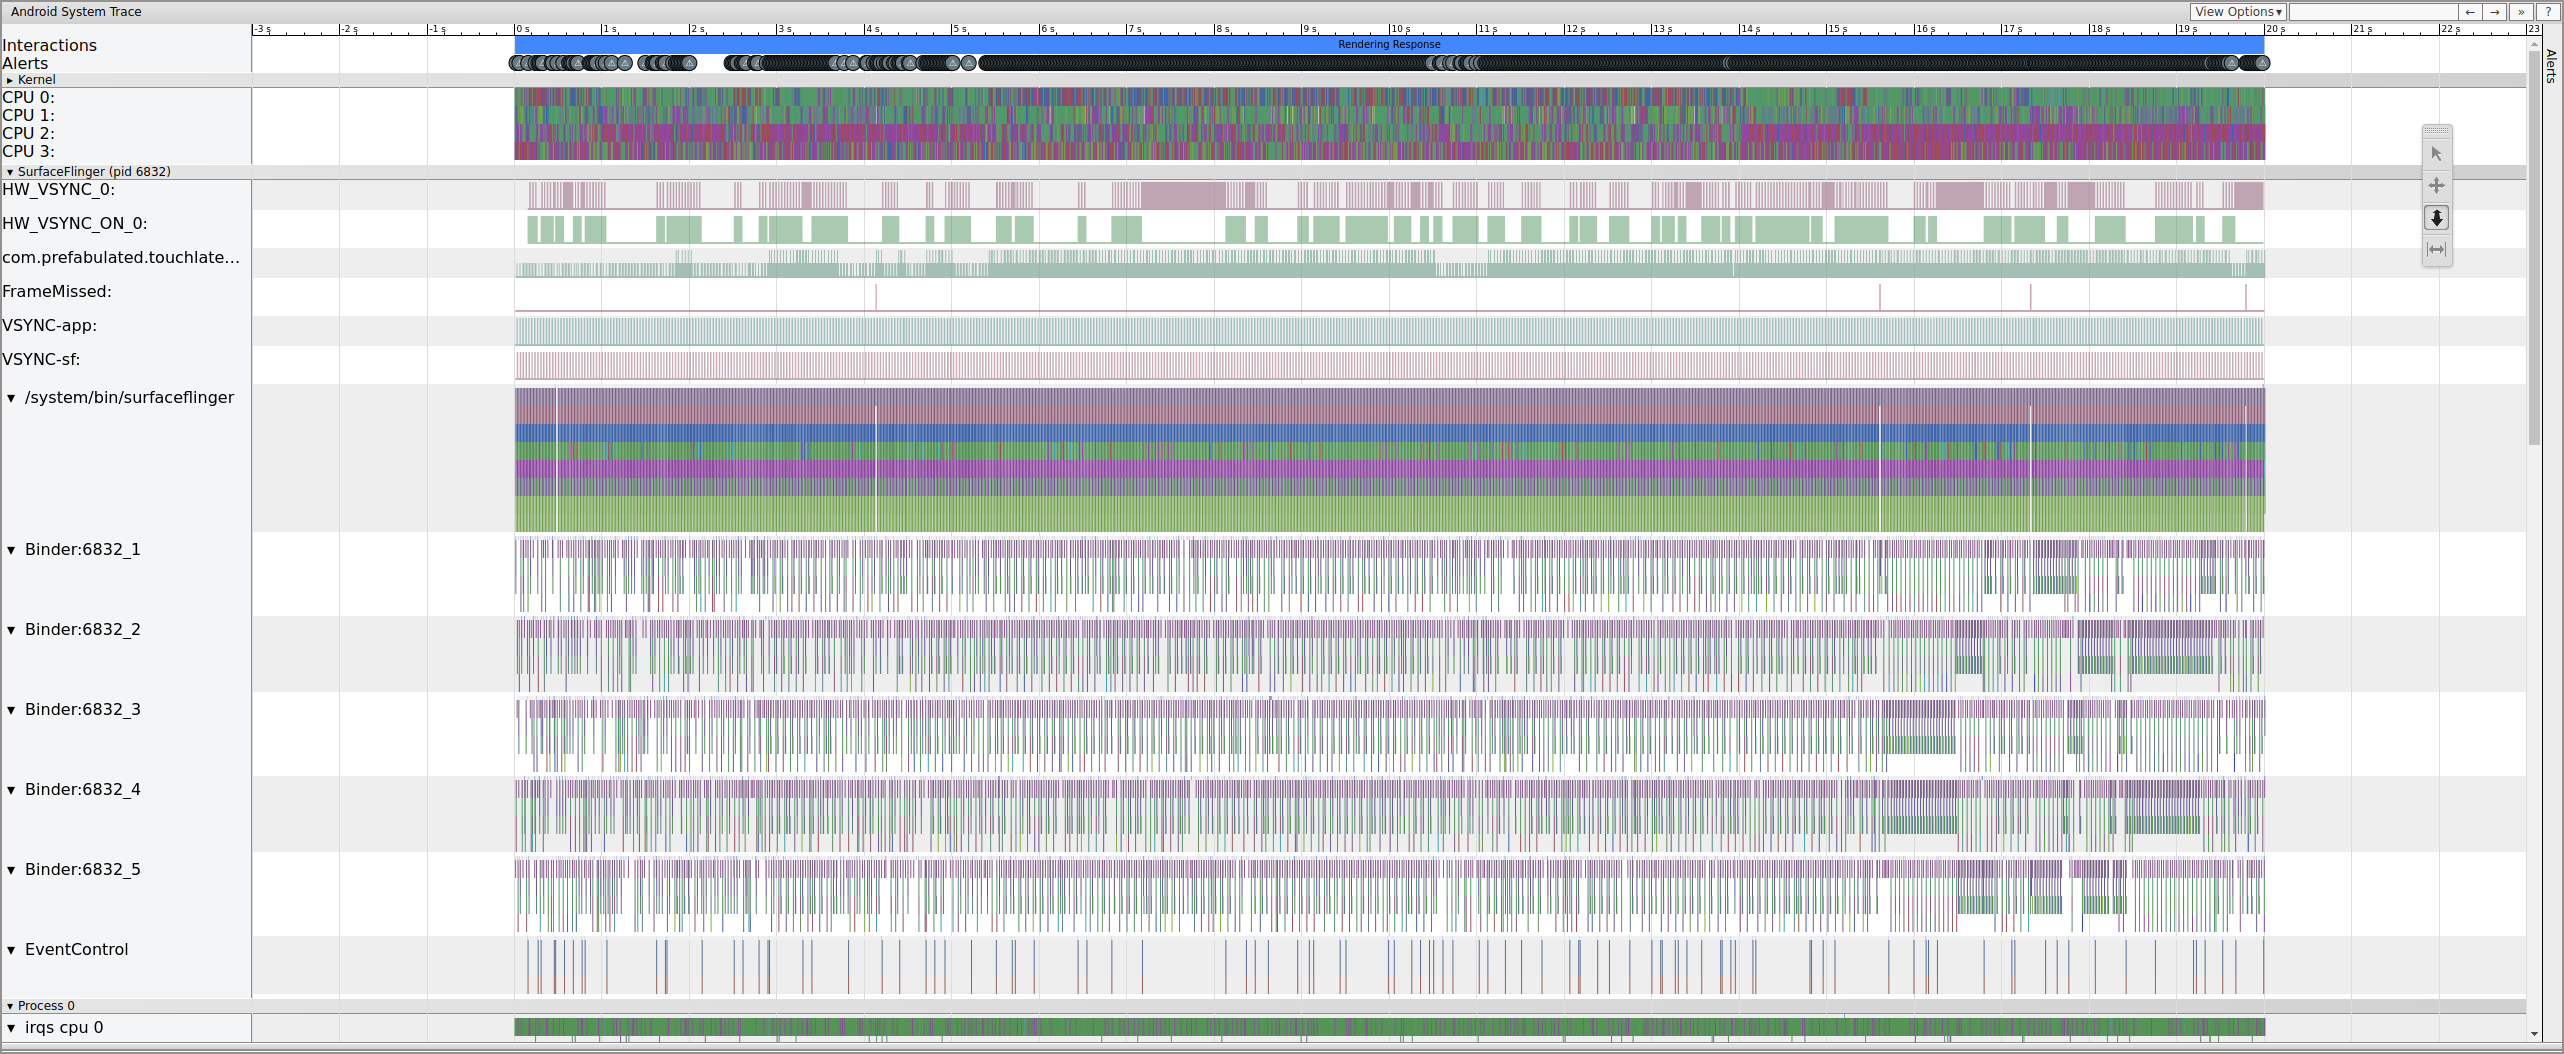
Figure 10. TouchLatency running on Pixel XL with most options enabled.
In figure 10, most options are enabled, including mdss and kgsl
tracepoints.
When looking for jank, check the FrameMissed row under SurfaceFlinger.
FrameMissed is a quality-of-life improvement provided by the HWC2. When viewing
systrace for other devices, the FrameMissed row might not be present if the device doesn't use the
HWC2. In either case, FrameMissed is correlated with SurfaceFlinger missing one of its
regular runtimes and an unchanged pending-buffer count for the app
(com.prefabulated.touchlatency) at a VSync.
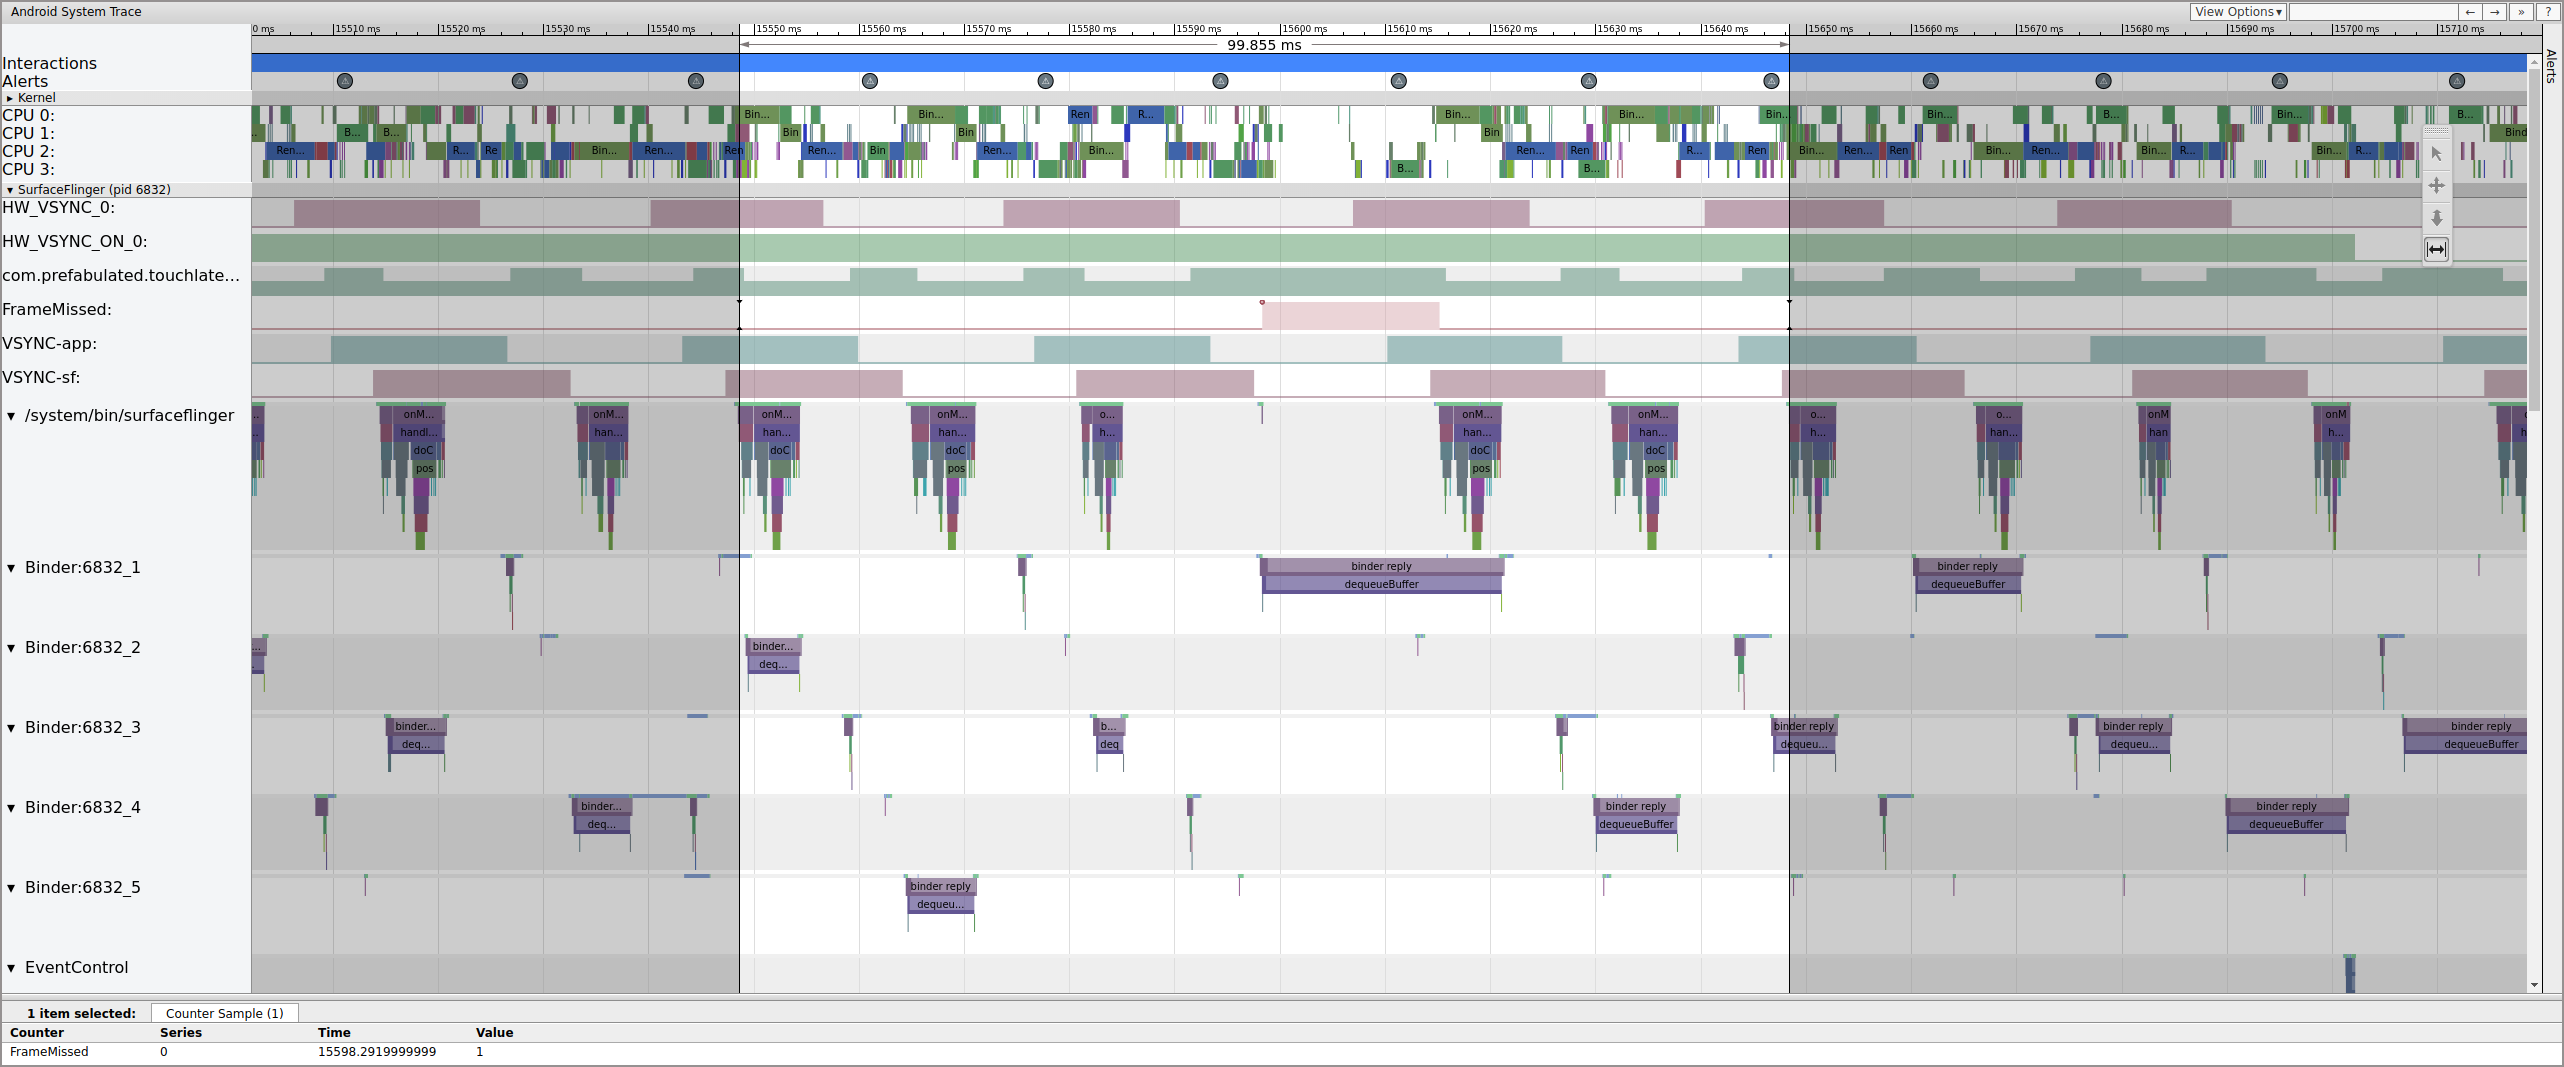
Figure 11. FrameMissed correlation with SurfaceFlinger.
Figure 11 shows a missed frame at 15598.29 ms. SurfaceFlinger woke briefly at the VSync interval and went back to sleep without doing any work, which means SurfaceFlinger determined it wasn't worth trying to send a frame to the display again.
To understand why the pipeline broke down for this frame, first review the working frame example above to see how a normal UI pipeline appears in systrace. When ready, return to the missed frame and work backward. Notice that SurfaceFlinger wakes and immediately goes to sleep. When viewing the number of pending frames from TouchLatency, there are two frames (a good clue to help determine what's going on).
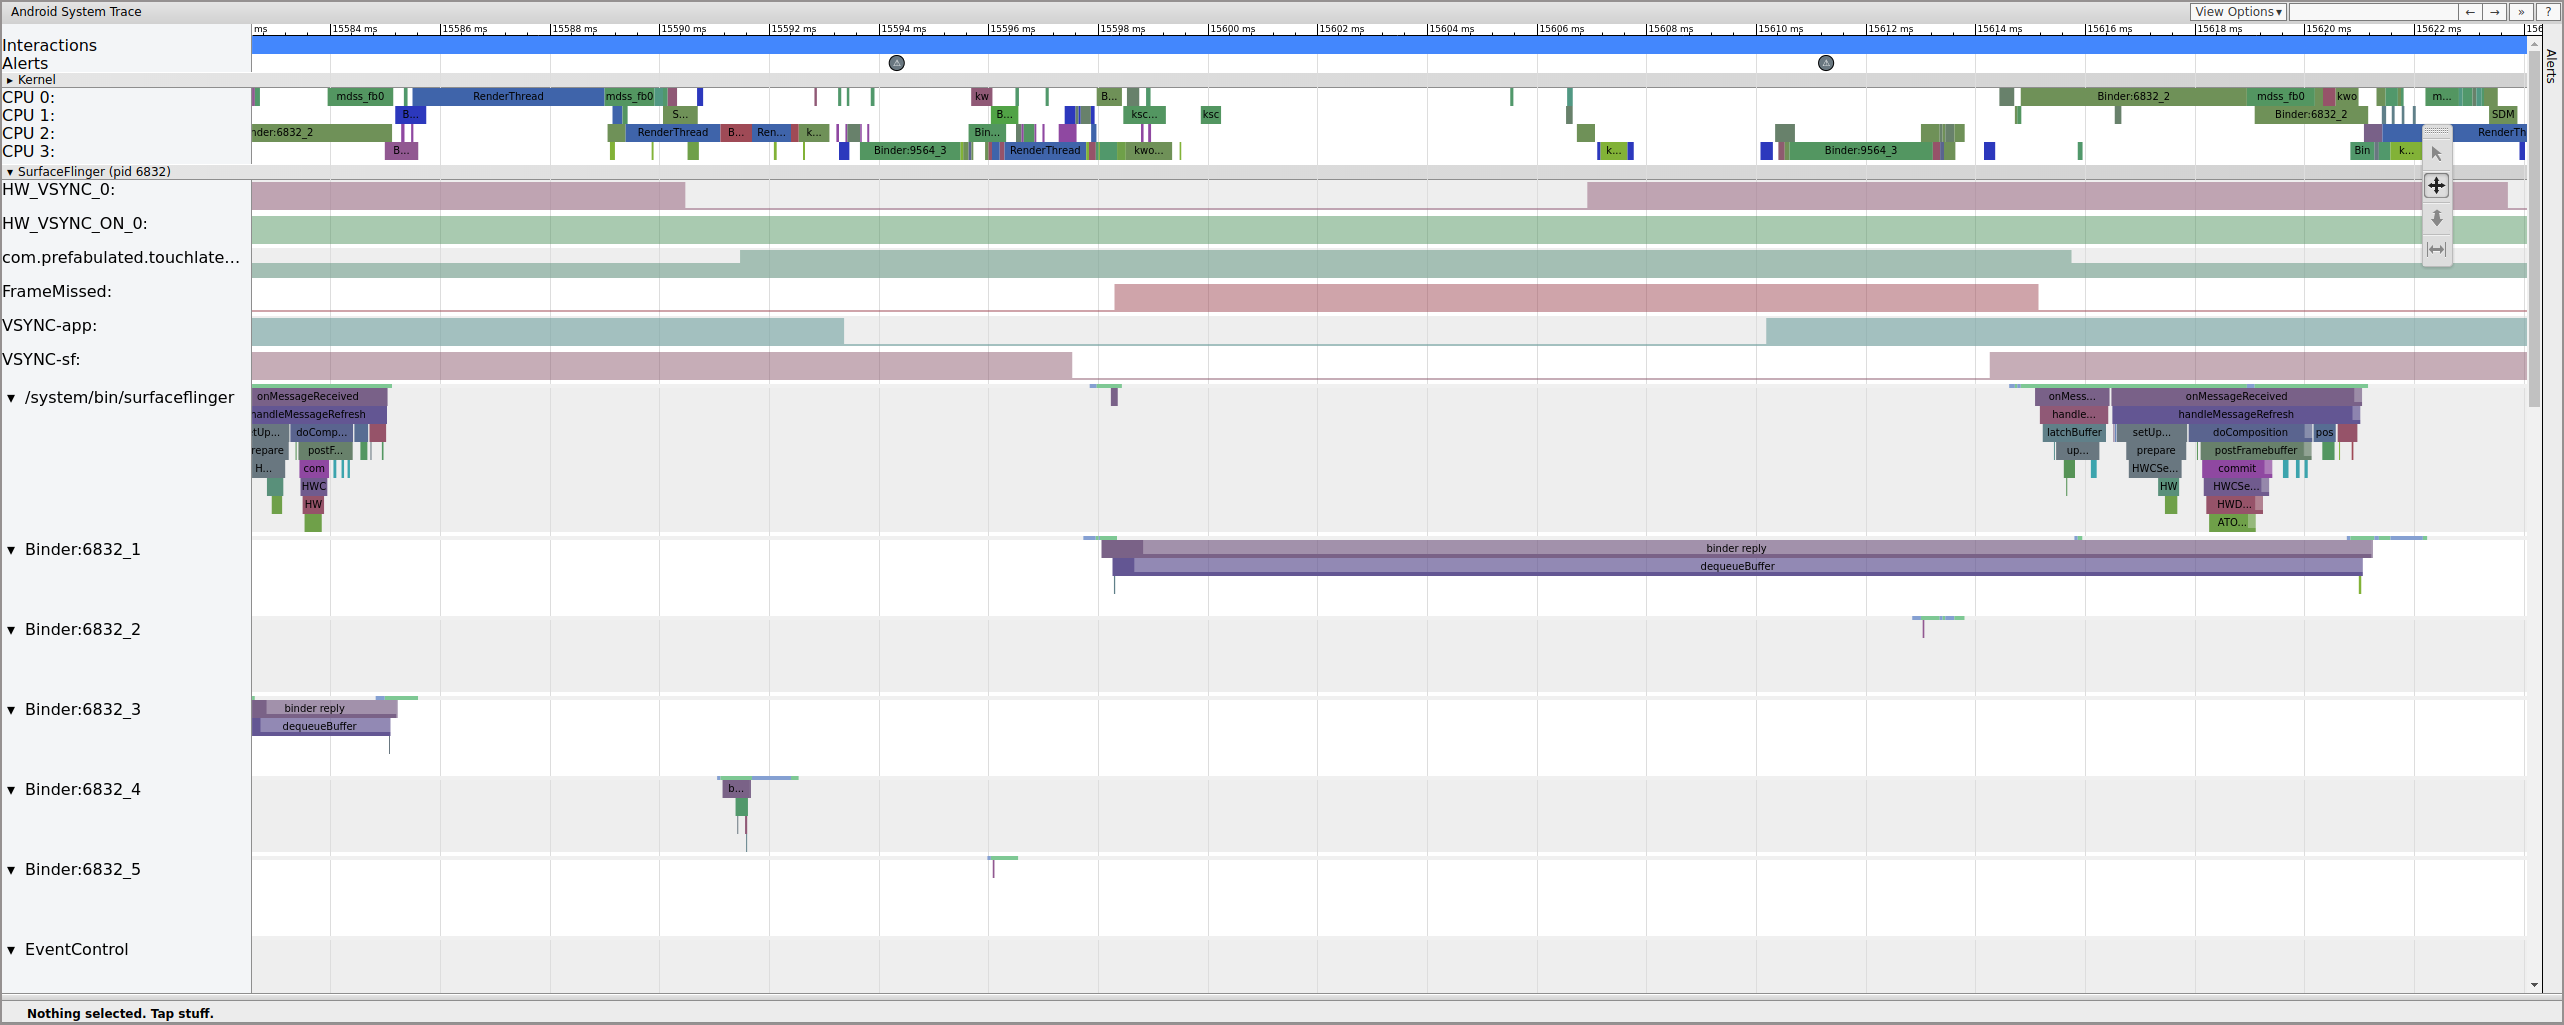
Figure 12. SurfaceFlinger wakes and immediately goes to sleep.
Because there are frames in SurfaceFlinger, it's not an app issue. In addition, SurfaceFlinger is waking at the correct time, so it's not a SurfaceFlinger issue. If SurfaceFlinger and the app both look normal, it's probably a driver issue.
Because the mdss and sync tracepoints are enabled,
you can get information about the fences (shared between the display driver and
SurfaceFlinger) that control when frames are submitted to the display.
These fences are listed under mdss_fb0_retire, which
denotes when a frame is on the display. These fences are provided as
part of the sync trace category. Which fences correspond to
particular events in SurfaceFlinger depends on your SOC and driver stack, so
work with your SOC vendor to understand the meaning of the fence categories in your
traces.
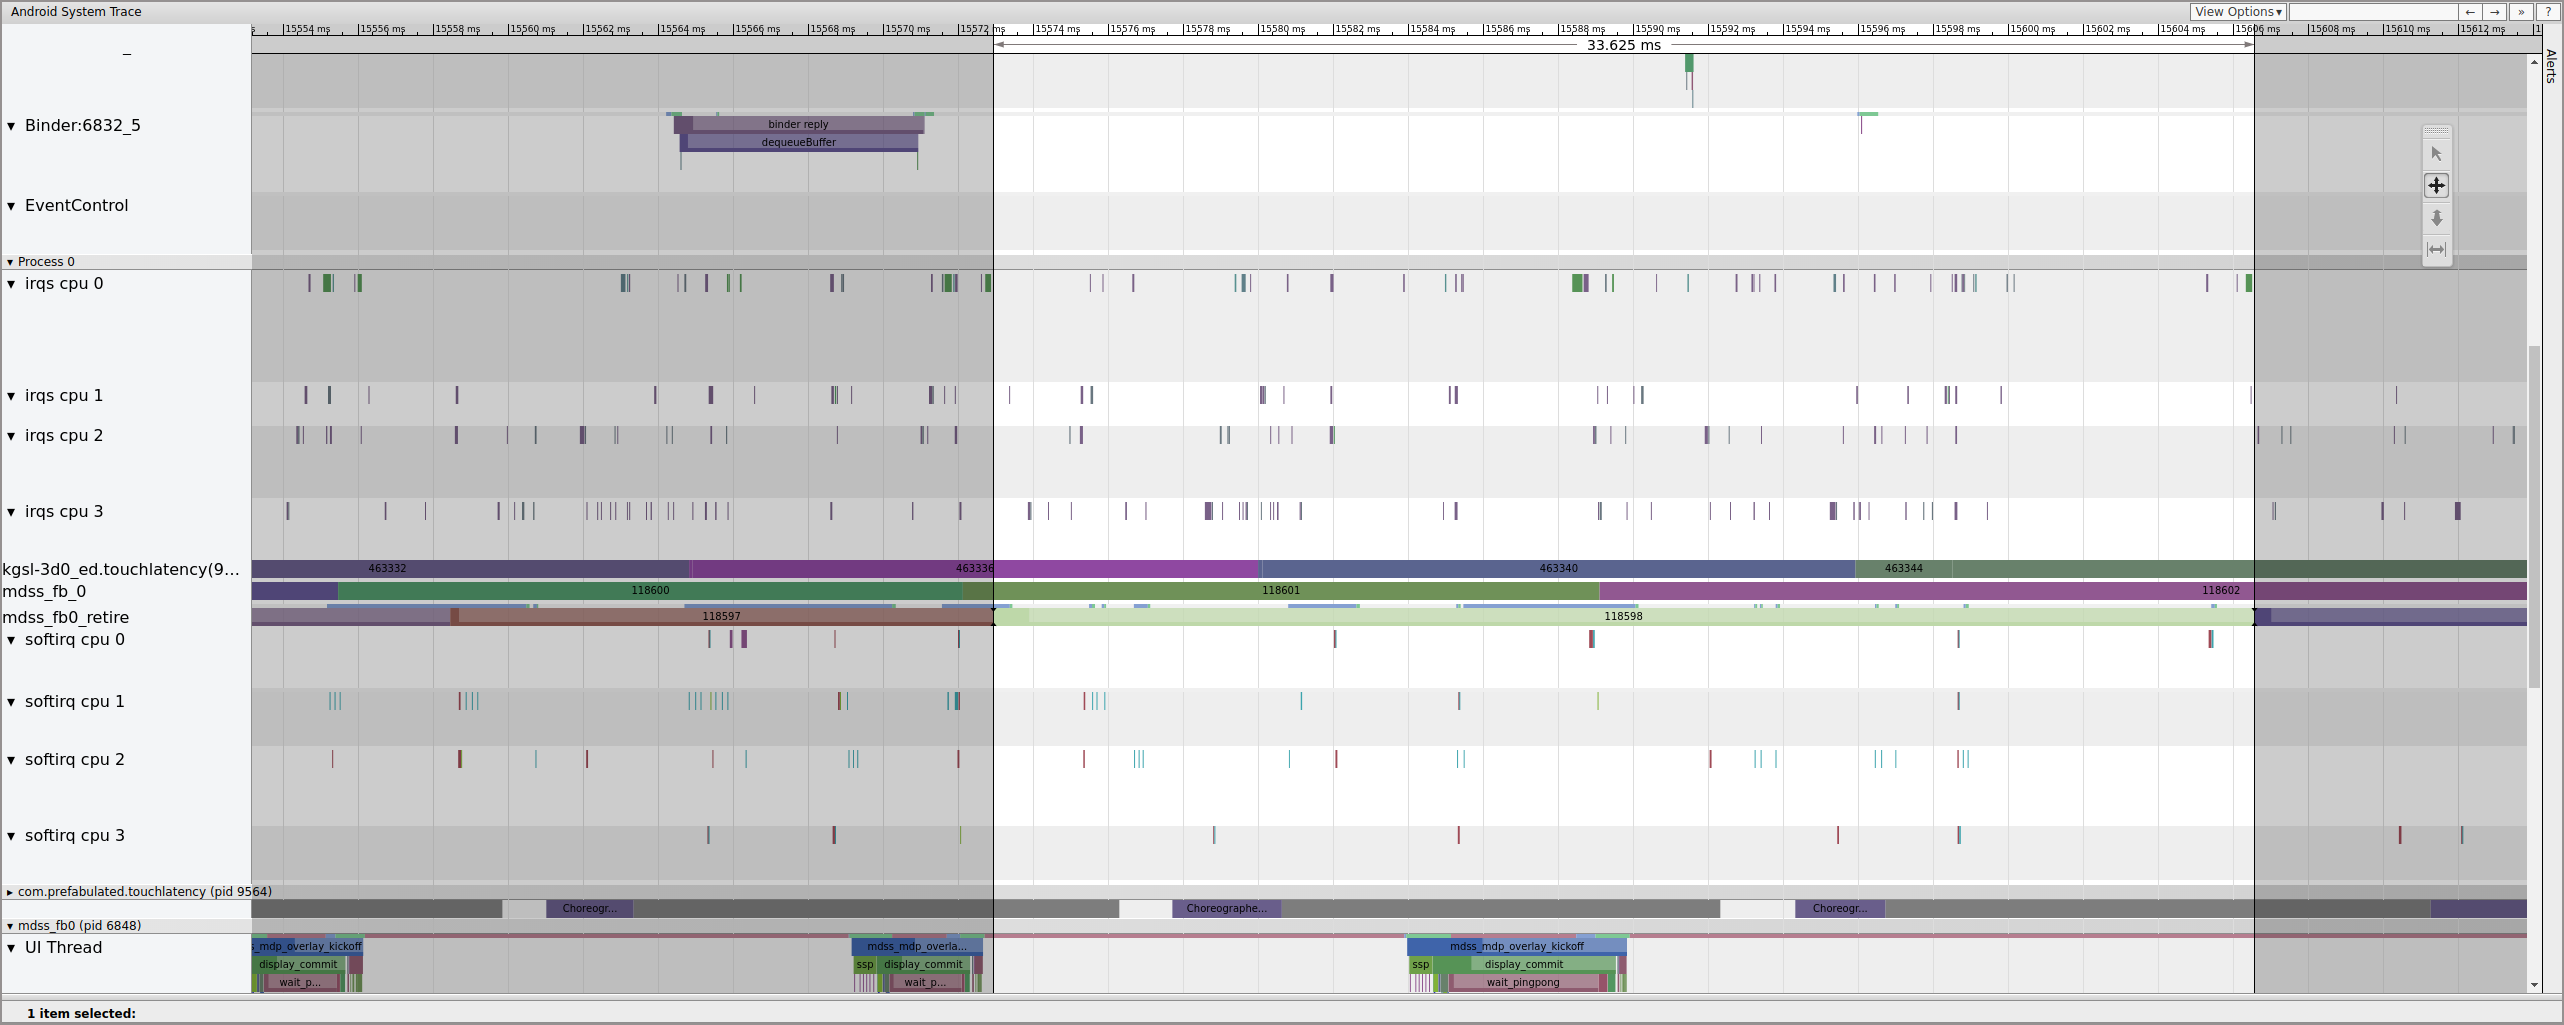
Figure 13. mdss_fb0_retire fences.
Figure 13 shows a frame that was displayed for 33 ms, not 16.7 ms as expected. Halfway through that slice, that frame should have been replaced by a new one but wasn't. View the previous frame and look for anything.
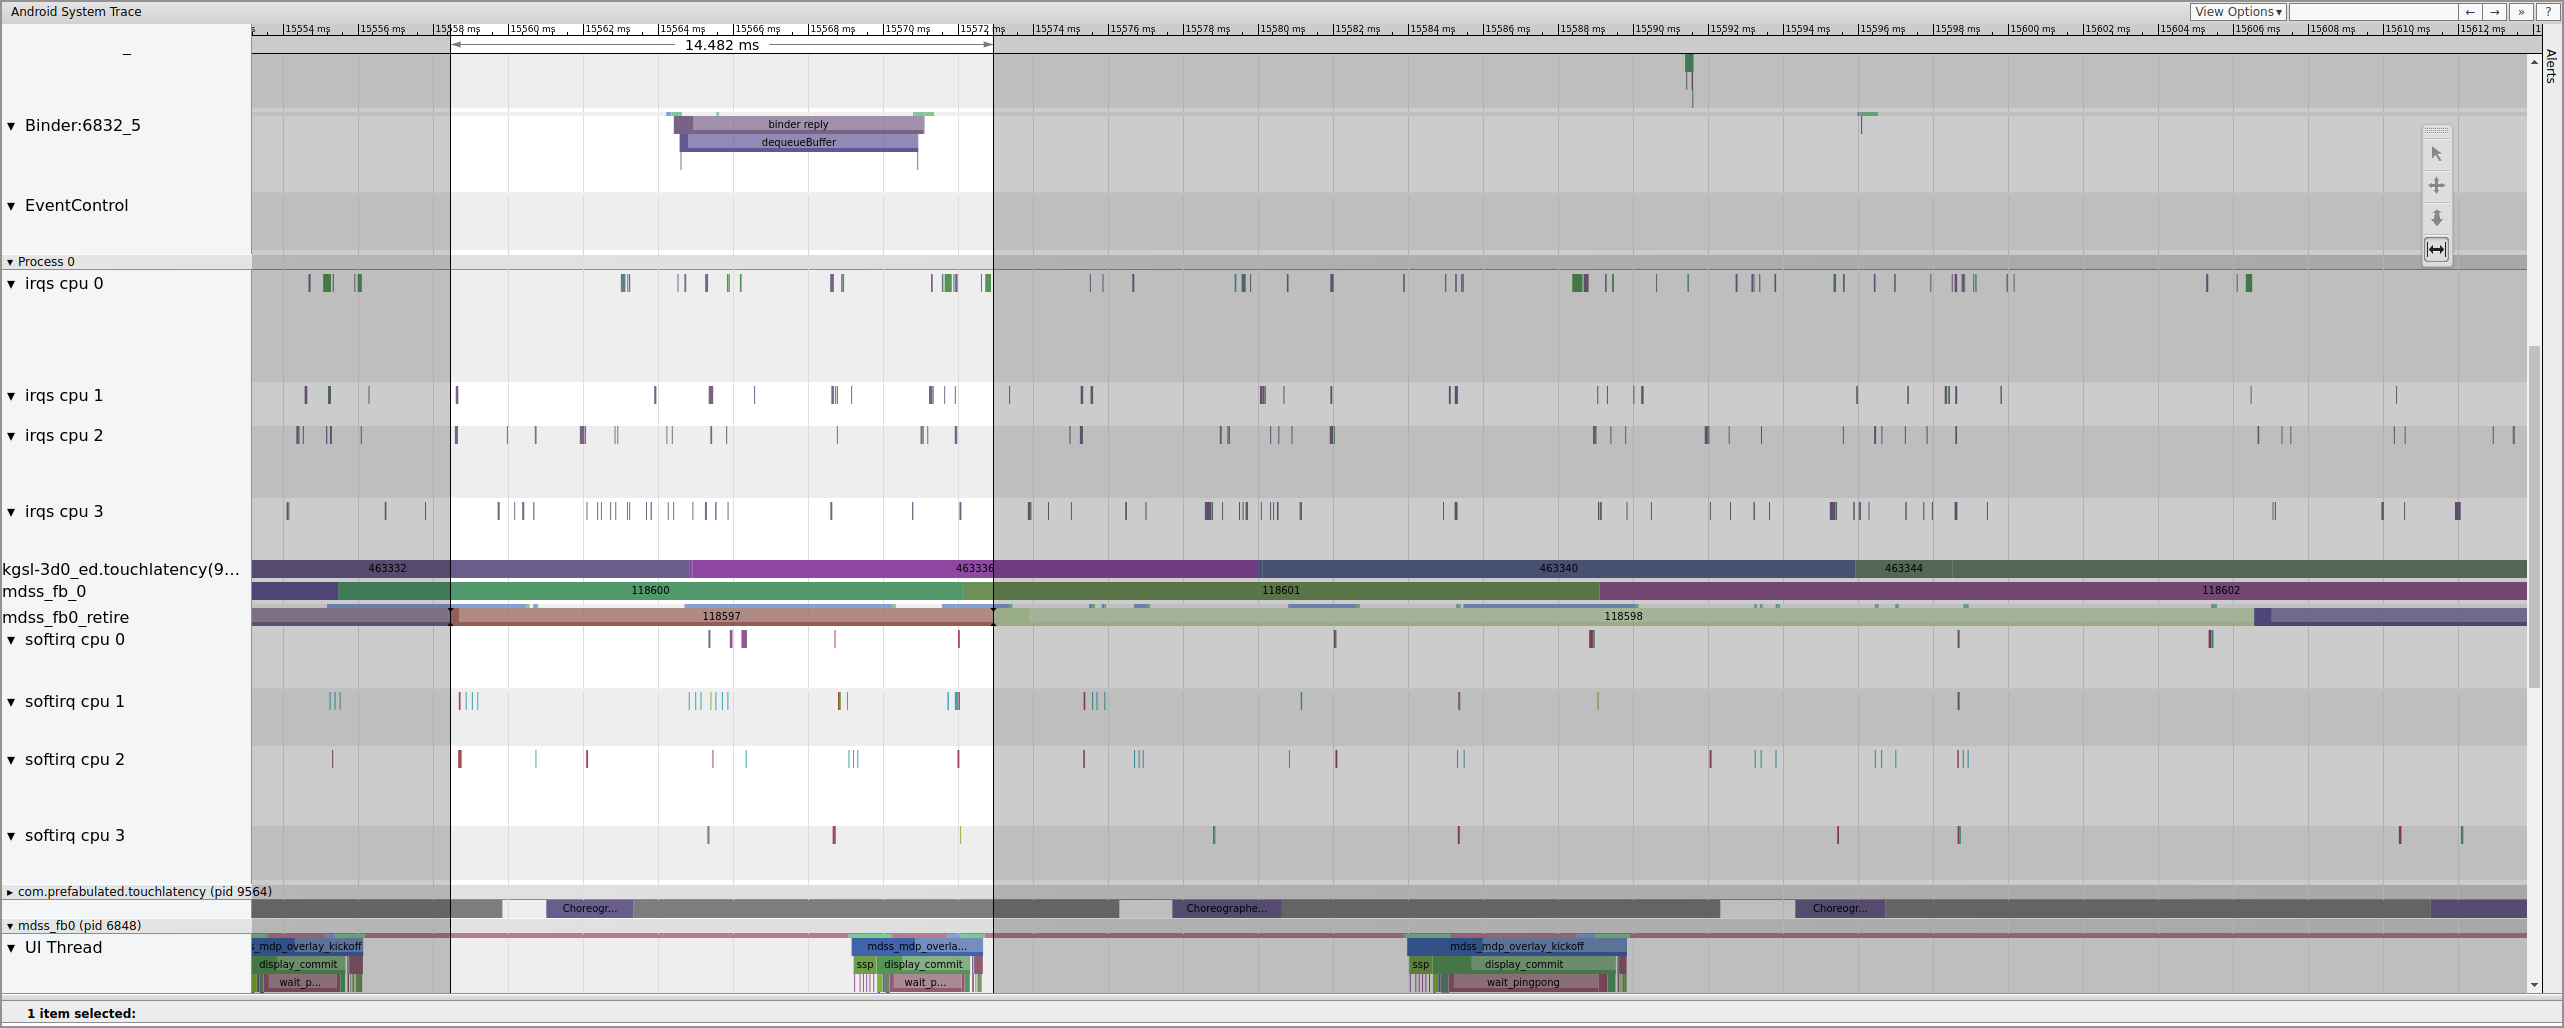
Figure 14. Frame previous to busted frame.
Figure 14 shows a 14.482 ms frame. The broken two-frame segment was 33.6 ms, which is roughly what is expected for two frames (rendered at 60 Hz, 16.7 ms per frame, which is close). But 14.482 ms isn't close to 16.7 ms, suggesting that something is wrong with the display pipe.
Investigate exactly where that fence ends to determine what controls it:
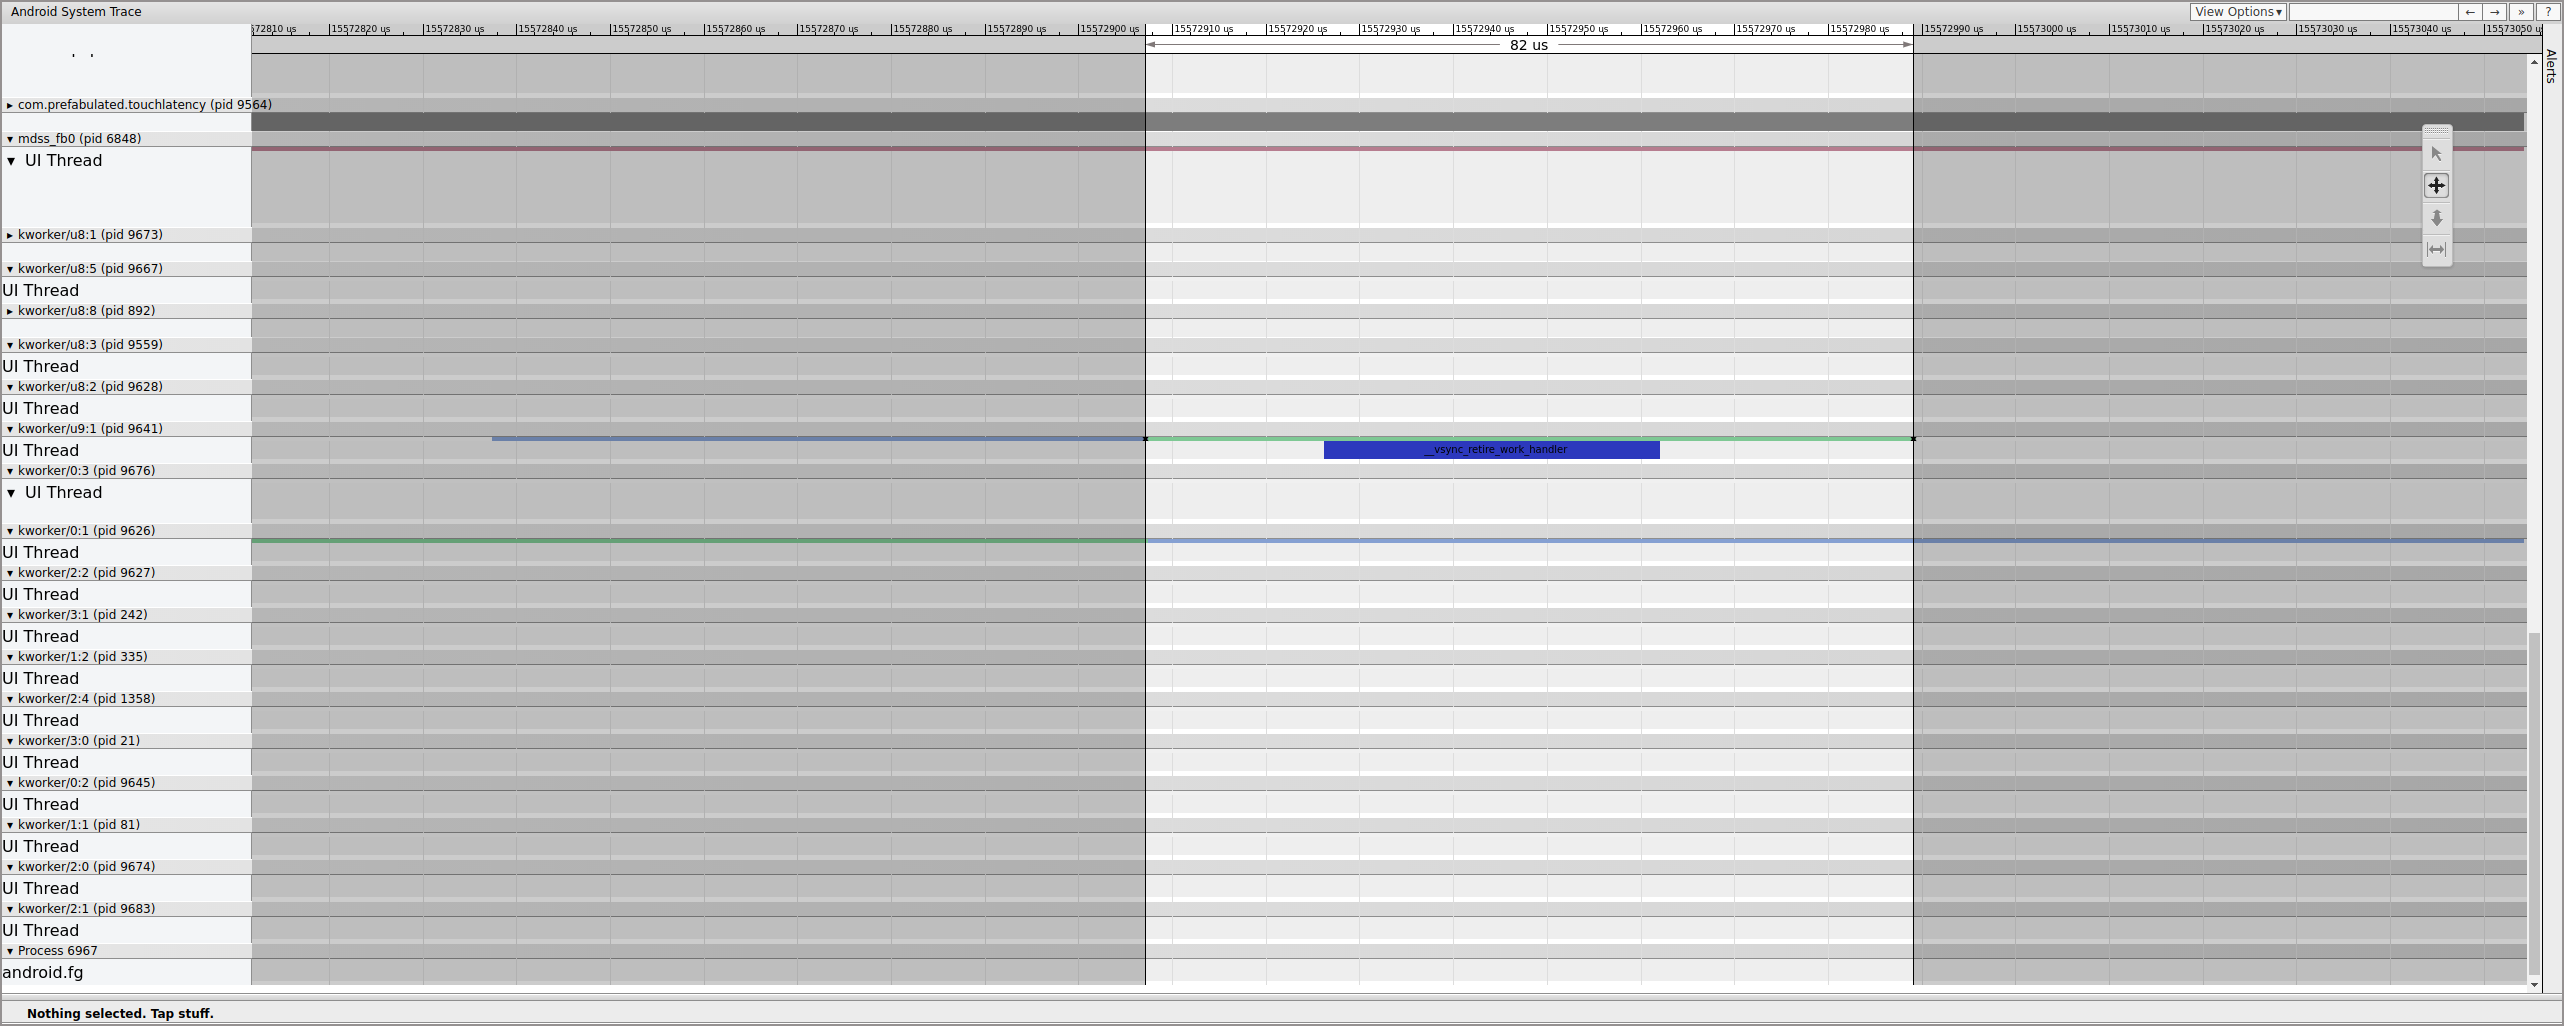
Figure 15. Investigate fence end.
A workqueue contains __vsync_retire_work_handler, which is
running when the fence changes. Looking through the kernel source, you can see that
it's part of the display driver. It appears to be on the critical
path for the display pipeline, so it must run as quickly as possible. It's
runnable for about 70 μs (not a long scheduling delay), but it's a workqueue and
might not be scheduled accurately.
Check the previous frame to determine if that contributed; sometimes jitter can add up over time and eventually cause a missed deadline:
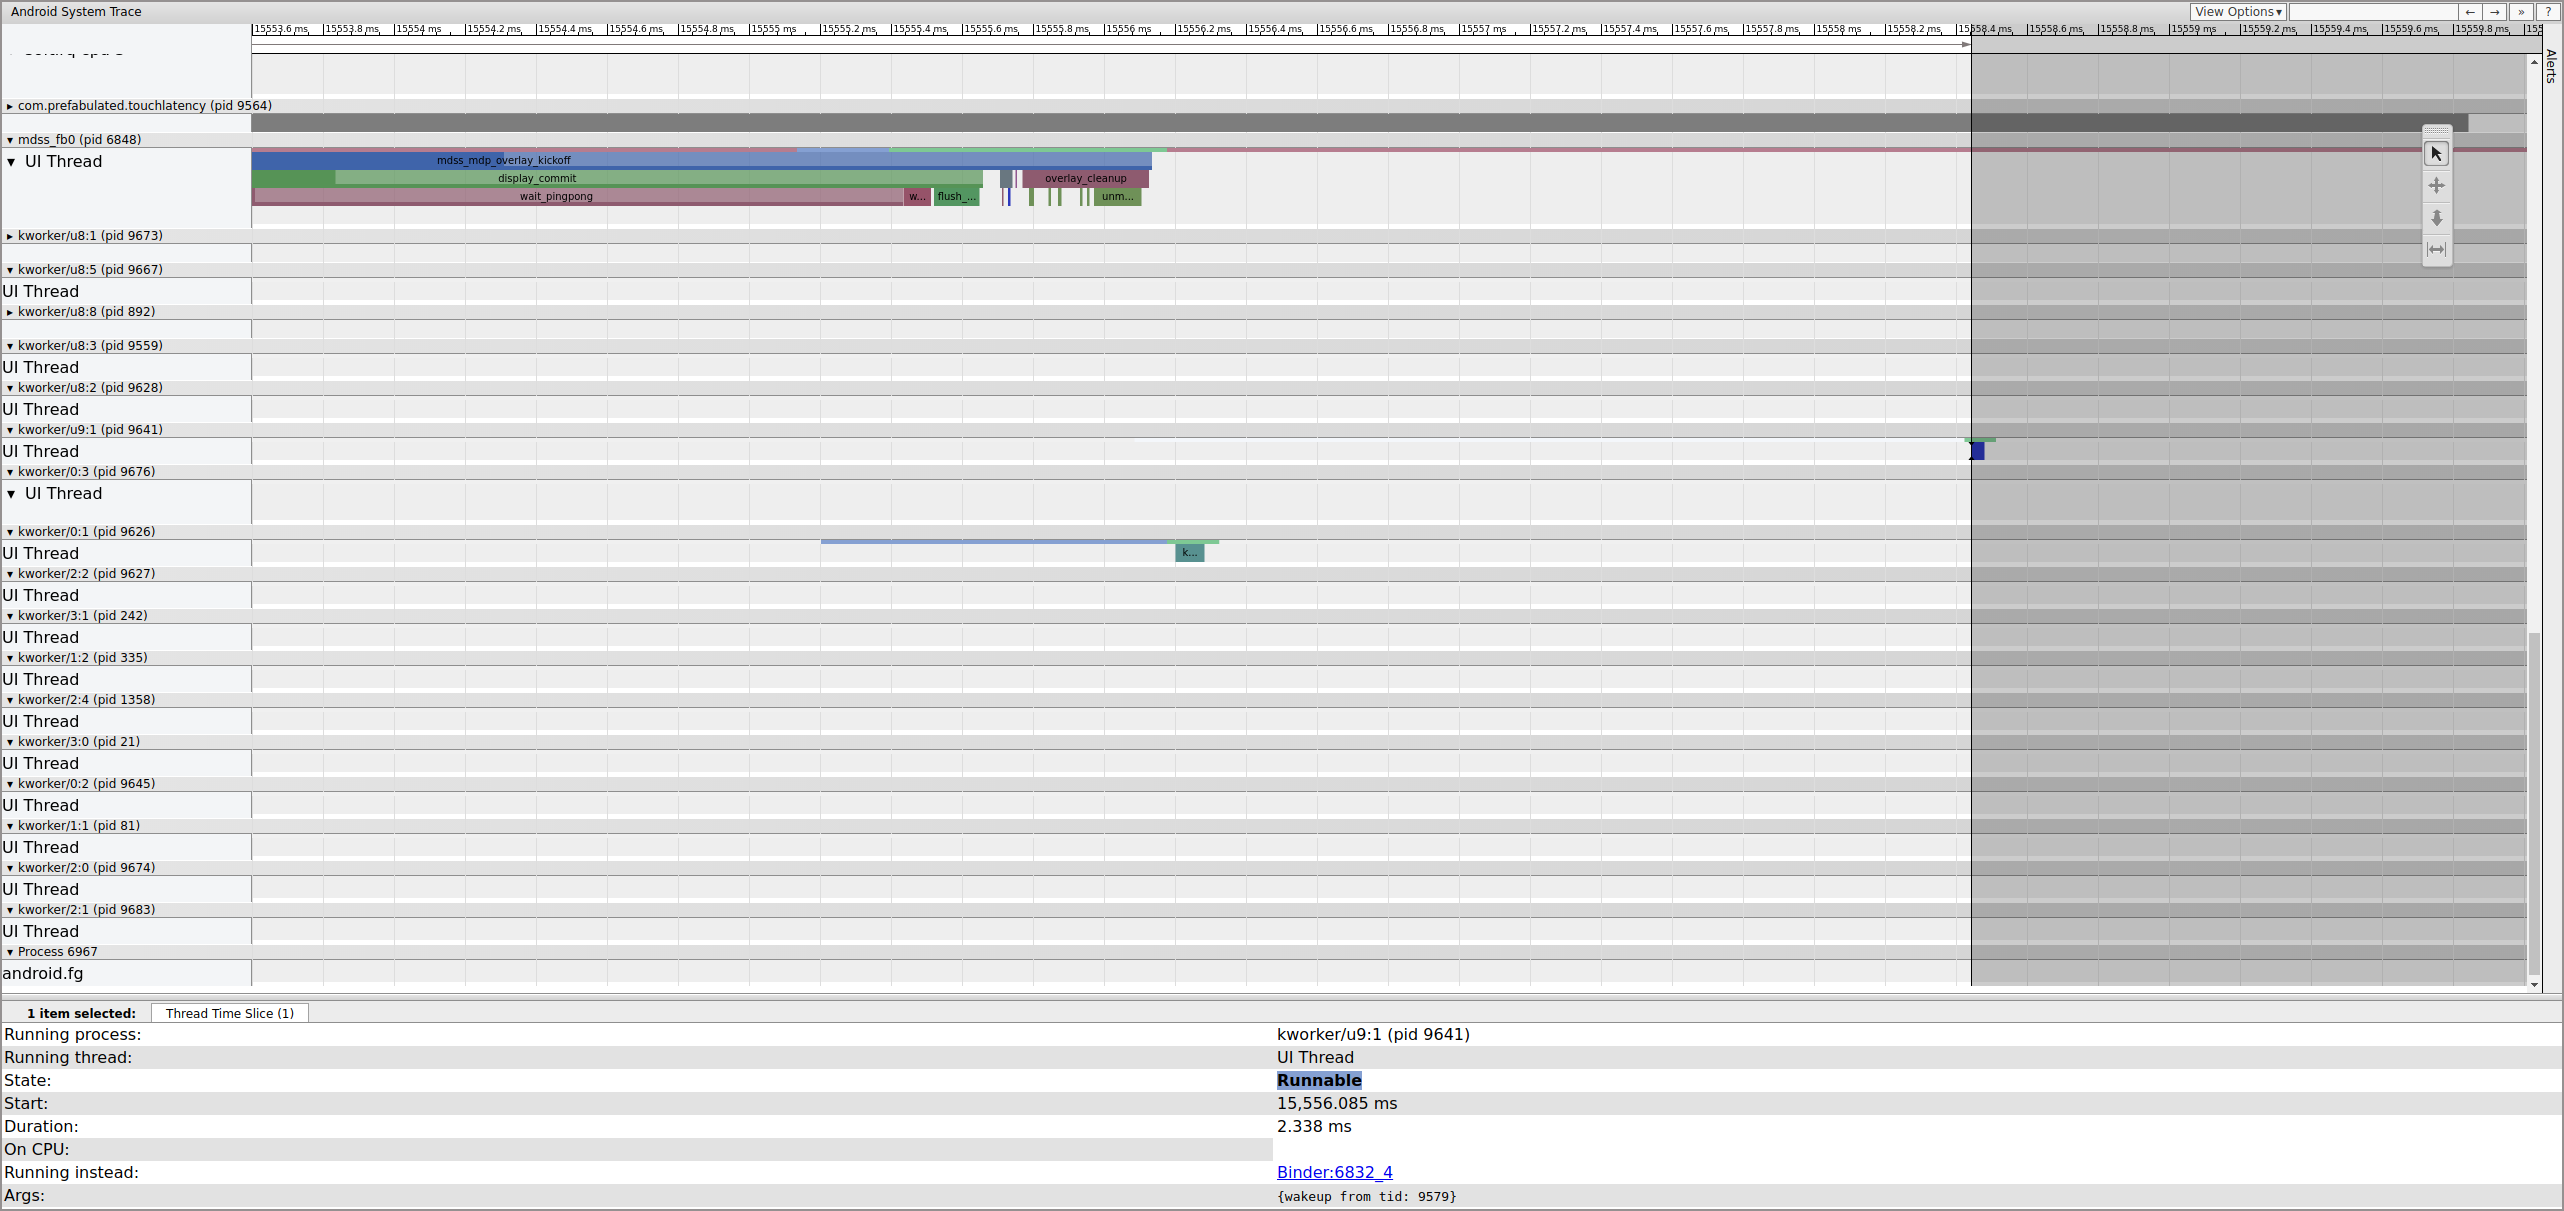
Figure 16. Previous frame.
The runnable line on the kworker isn't visible because the viewer turns it
white when it's selected, but the statistics tell the story: 2.3 ms of scheduler
delay for part of the display pipeline critical path is bad.
Before continuing, fix the delay by moving this part of the
display pipeline critical path from a workqueue (which runs as a
SCHED_OTHER CFS thread) to a dedicated SCHED_FIFO
kthread. This function needs timing guarantees that workqueues can't (and aren't
intended to) provide.
It's not clear that this is the reason for the jank. Outside of easy-to-diagnose cases such as kernel lock contention causing display-critical threads to sleep, traces usually don't specify the problem. This jitter might have been the cause of the dropped frame. The fence times should be 16.7 ms, but they aren't close to that at all in the frames leading up to the dropped frame. Given how tightly coupled the display pipeline is, it's possible that the jitter around the fence timings resulted in a dropped frame.
In this example, the solution involves converting
__vsync_retire_work_handler from a workqueue to a dedicated
kthread. This results in noticeable jitter improvements and reduced jank in the
bouncing ball test. Subsequent traces show fence timings that hover very close
to 16.7 ms.