The VTS Dashboard provides a cohesive user interface that uses material design to effectively display information about test results, profiling, and coverage. Dashboard styling uses open-source Javascript libraries including Materialize CSS and jQueryUI to process data delivered by Java servlets in Google App Engine.
Dashboard home
The Dashboard home page displays a list of test suites a user has added to favorites.
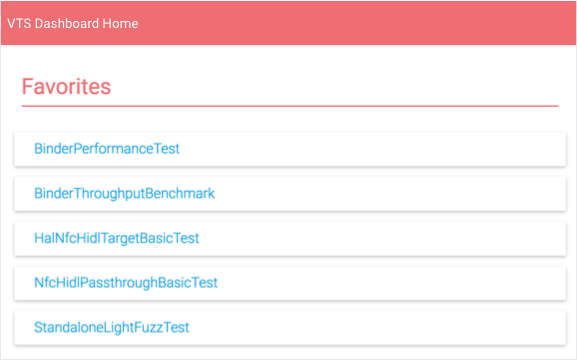
From this list, users can:
- Select a test suite to view results for that suite.
- Click SHOW ALL to view all VTS test names.
- Select the Edit icon to modify the Favorites list.
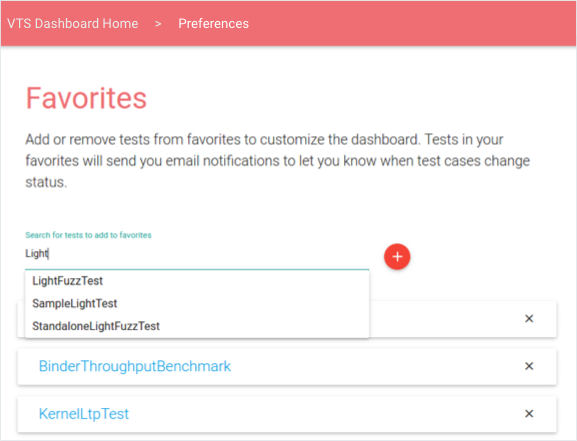
Figure 2. VTS Dashboard, editing Favorites page.
Test results
Test Results displays the latest information about the selected test suite, including a list of profiling points, a table of test case results in chronological order, and a pie chart displaying the result breakdown of the latest run (users can load older data by paging right).
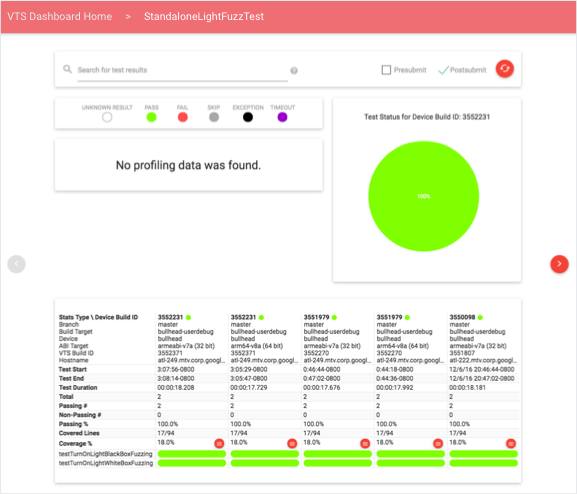
Users can filter data using queries or by modifying the test type (pre-submit, post-submit, or both). Search queries support general tokens and field-specific qualifiers; supported search fields are: device build ID, branch, target name, device name, and test build ID. These are specified in the format: FIELD-ID="SEARCH QUERY". Quotes are used to treat multiple words as a single token to match with the data in the columns.
Data profiling
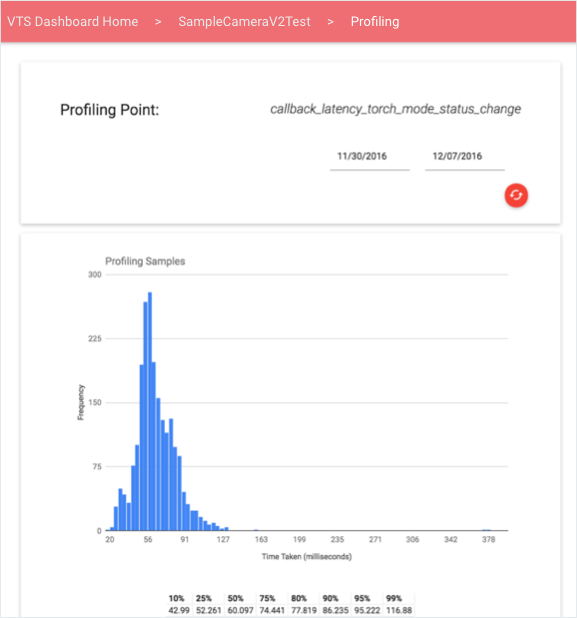
Users can select a profiling point to reach an interactive view of the quantitative data for that point in a line graph or histogram (examples below). By default, the view displays the latest information; users can use the date picker to load specific time windows.
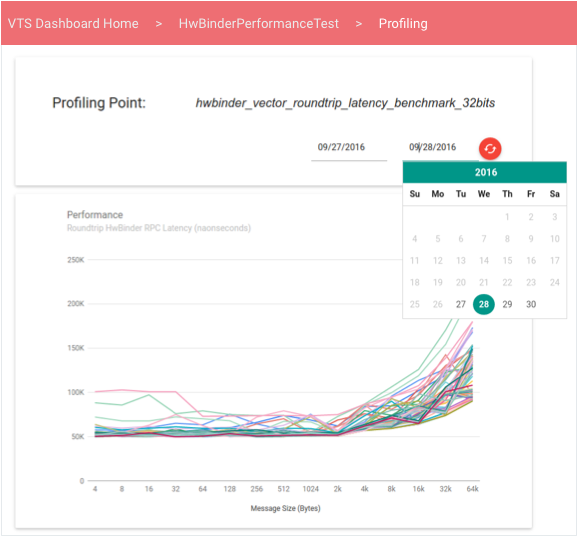
Line graphs display data from a collection of unordered performance values, which can be useful when a test of performance produces a vector of performance values that vary as a function of another variable (e.g., throughput versus message size).
Test coverage
Users can view coverage information from the coverage percent link in test results.
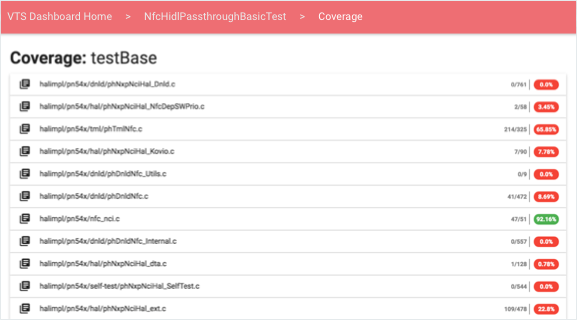
For each test case and source file, users can view an expandable element containing color-coded source code according to the coverage provided by the selected test:
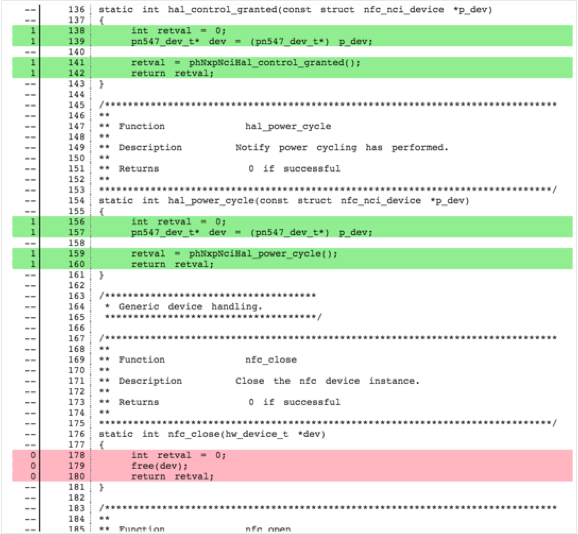
- Uncovered lines are highlighted red.
- Covered lines are highlighted green.
- Non-executable lines are uncolored.
Coverage information is grouped depending into sections depending on how it was provided at run-time. Tests may upload coverage:
- Per function. Section headers have the format "Coverage: FUNCTION-NAME".
- In Total (provided at the end of the test run). Only one header is present: "Coverage: All".
The Dashboard fetches source code client-side from a server, which uses the open-source Gerrit REST API.
Monitoring and testing
The VTS Dashboard provides the following monitors and unit tests.
- Test email alerts. Alerts are configured in a Cron job that executes at a fixed interval of two (2) minutes. The job reads the VTS status table to determine if new data has been uploaded to each table, done by checking the test's raw data upload timestamp is newer than the last status update timestamp. If the upload timestamp is newer, the job queries for new data between now and the last raw data upload. New test case failures, continued test case failures, transient test case failures, test case fixes, an inactive tests are determined; this information is then sent in email format to the subscribers of each test.
- Web service health. Google Stackdriver integrates with Google App Engine to provide easy monitoring of the VTS Dashboard. Simple uptime checks verify pages can be accessed while other tests can be created to verify latency on each page, servlet, or database. These checks ensure the Dashboard is always accessible (else an administrator will be notified).
- Analytics. You can integrate a VTS Dashboard page with Google Cloud Analytics by specifying a valid Analytics ID in the page configuration (the pom.xml file). Integration provides a more robust analysis of page usage, user interaction, locality, session statistics, etc.
