Use the data provided in the performance tables to populate the performance map of the ecosystem. Follow the recommended data visualization how-to guide when populating the performance map. Align the data acquired from the DUT to the performance map for comparison.
Visualize the data in the performance map
The performance map for Effect 1 and Effect 2 is drawn with peak duration, peak amplitude, and figure of merit for sharpness (FOMS = PRR / peak duration). When aligning your data to the performance map, carefully follow the data in the x axis (peak duration), y axis (peak amplitude), and the bubble size (FOMS). The performance map is presented with several categories, including price tier (low, medium, high) and actuator type (X-LRA, Z-LRA, ERM). Use different colors to represent different categories.
The performance map assists with the evaluation of the target device using a contextually relative comparison (rather than a pass or fail judgement). When interpreting the comparison results between the performance map and your DUT measurement, build your expectations based on the categories that the phone belongs to, then consider these questions:
- Where on the map are your device's performance characteristics located?
- Considering many conditions (for example, price tier or actuator type), is your device outperforming, equal to, or underperforming your competitors?
- Do the results meet your expectations? If not, which factor underperformed?
For example, if the performance from your budget phone with ERM is equivalent to that of premium X-LRA phones, the budget phone has outstanding quality haptics compared to similar budget phones with ERM.
In EFFECT_CLICK (Effect 1) and createOneShot (Effect 2), the x axis and y
axis refer to the peak duration and peak amplitude, respectively. The size of
the bubble indicates the figure of merit for sharpness (FOMS = PRR / peak
duration), and the color codes in the legend represent categories for further
segmentation (price tier or actuator types). For example, in the performance map
segmented by the price tier (for example, low/medium/high), the color of each
bubble represents the price tier. By matching the bubble's color with your
phone's price tier, you can compare your phone with competitors in the
same price tier.
The green bubble in Figure 1 shows high-quality haptics for EFFECT_CLICK
(Effect 1). Effects are typically crisp and strong when the duration is short,
the amplitude is high, and bubble size is large.
The red bubble in Figure 1 shows the low-quality haptics from EFFECT_CLICK
(Effect 1). Effects are typically buzzy, mushy, and weak when the duration is
long, the amplitude is low, and the bubble size is small.
The dotted red line indicates the minimum amplitude threshold. If the amplitude is weaker than 0.1 g, the haptic isn't perceivable by users (failure case F03-2).
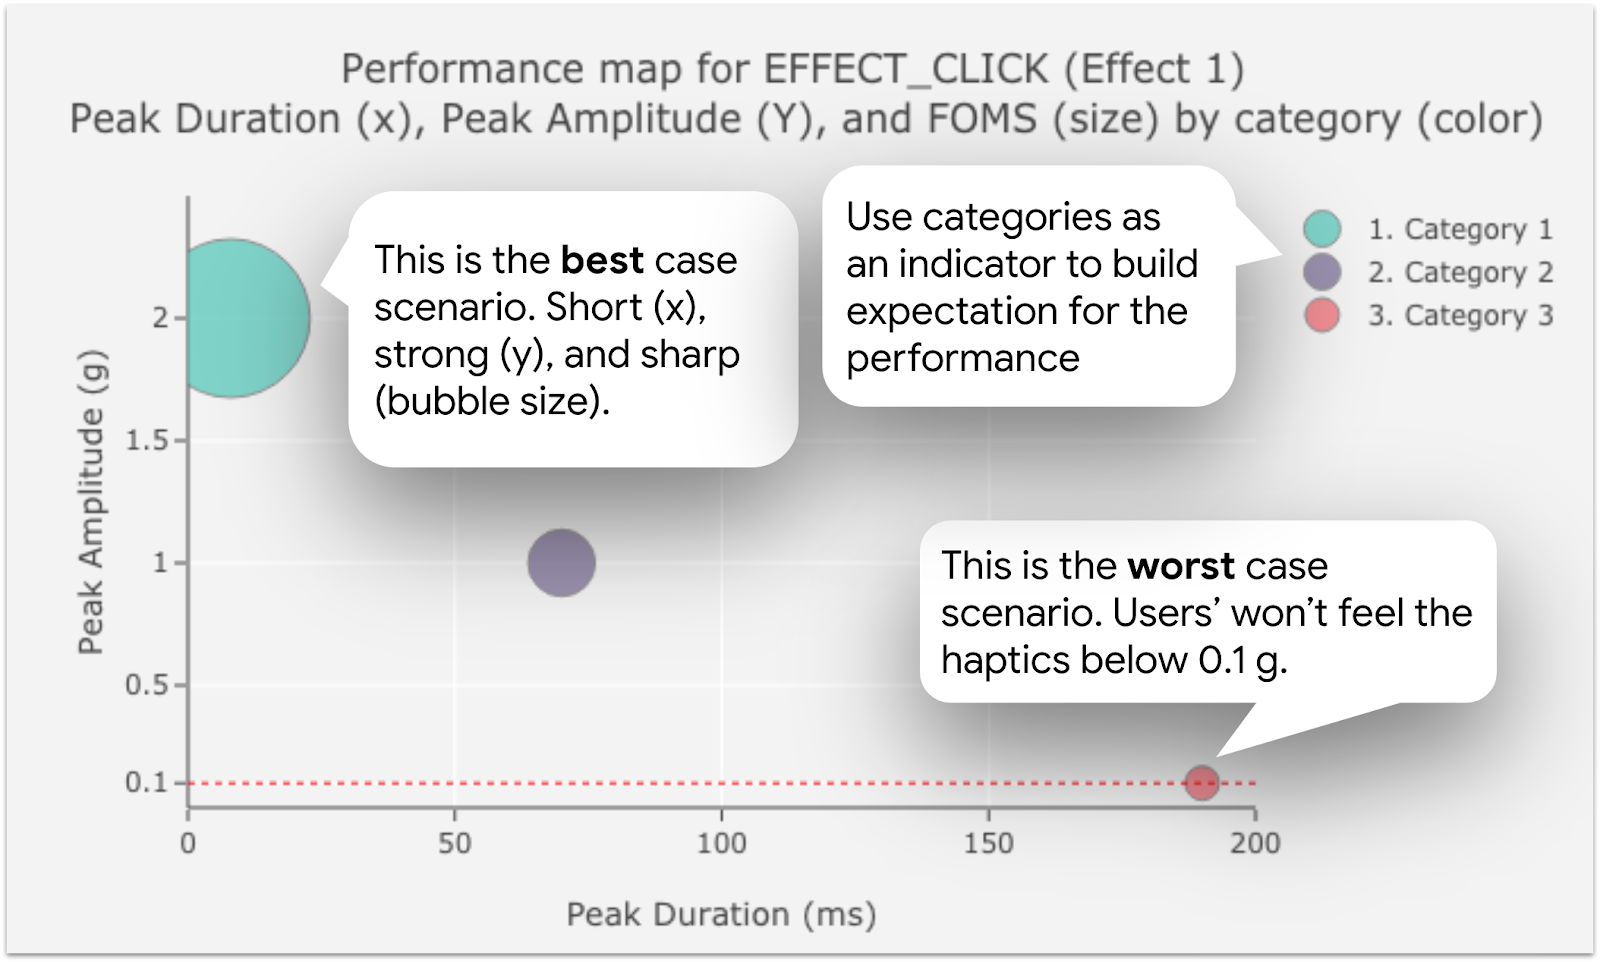
Figure 1. Performance map for Effect 1 how-to guides
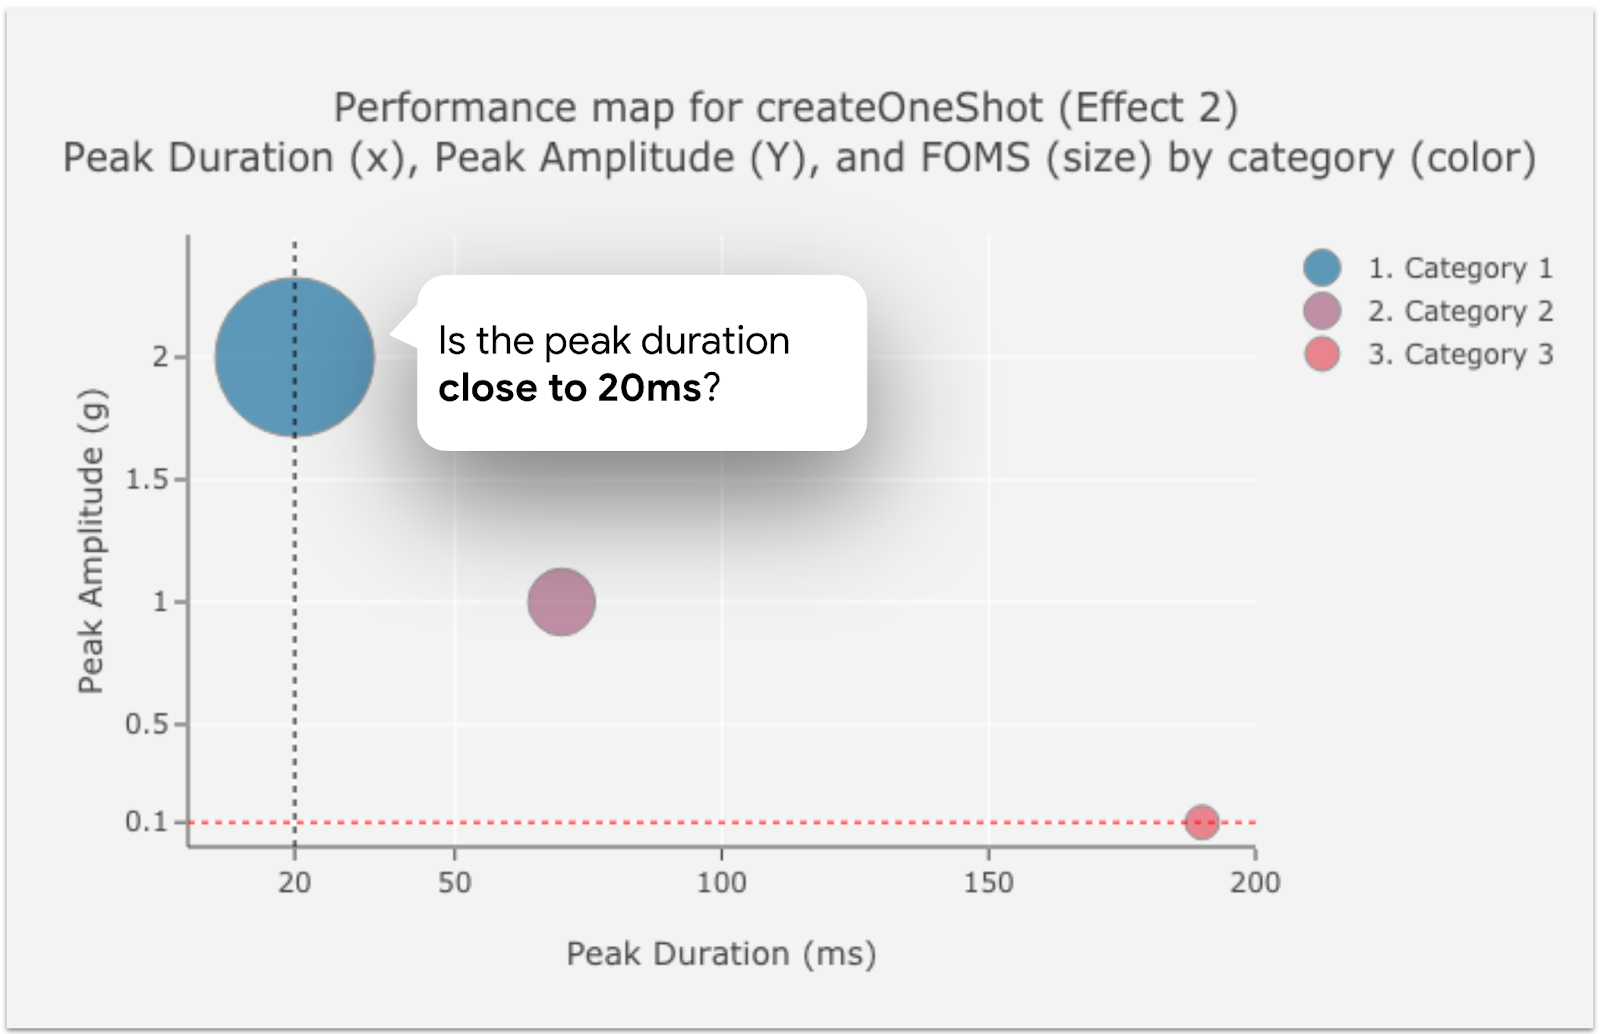
Figure 2. Performance map for Effect 2 how-to guides
Reading data from createOneShot (Effect 2) is an almost identical process to
Effect 1 data, with one exception. Because the target duration of Effect 2 is
20 ms, the peak duration close to 20 ms represents the output with
good braking.
Data from createWaveform (Effect 3) focuses on amplitude control capabilities.
The target ratio between the first acceleration (Acceleration 1 = 50% amplitude
= left bar in the group bar chart) and the second acceleration (Acceleration 2 =
100% amplitude = right bar in the grouped bar chart) is 2.
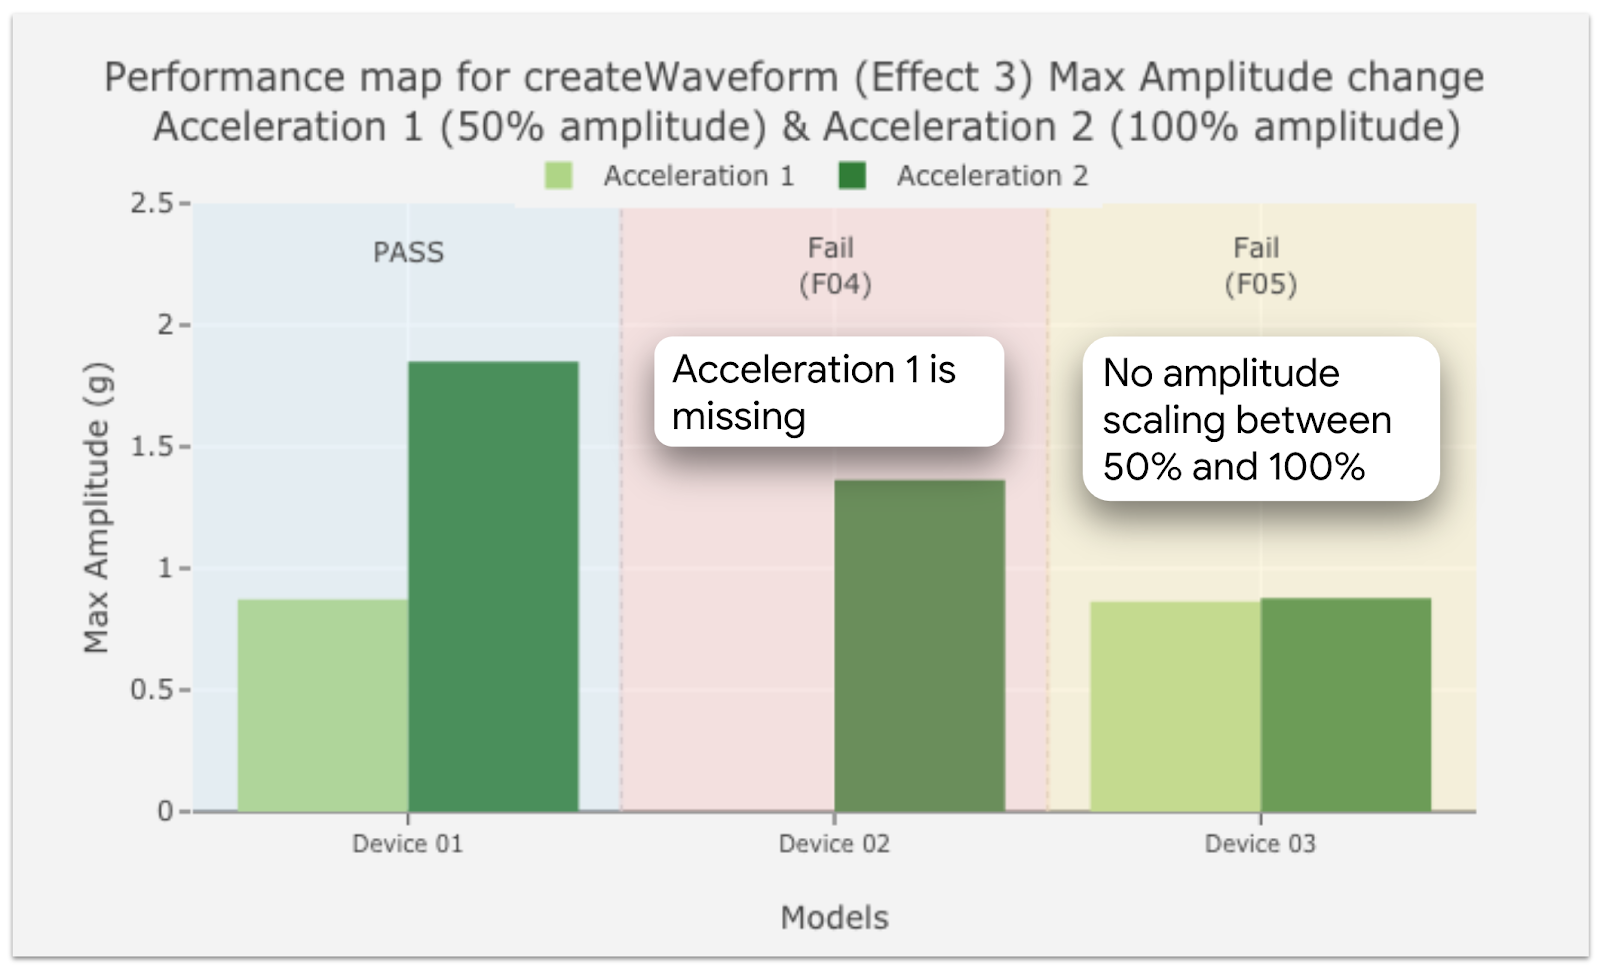
Figure 3. Performance map for Effect 3 how-to guides
Performance map data and illustrations
This data applies to the performance maps:
- Test date: April 12, 2020
- Number of device models tested: 28
- Number of device manufacturers tested: 10
- Device release period: Up to 18 months prior to the test date
Haptic effects observed in the performance map:
VibrationEffect.EFFECT_CLICK(Effect 1)VibrationEffect.createOneShot(Effect 2)VibrationEffect.createWaveform(Effect 3)
Price tier segmentation
- High (600 USD or higher)
- Medium (from 300 USD to 600 USD)
- Low (up to 300 USD)
Failure cases
- F01: Haptic constant isn't implemented. No signal to analyze.
- F02: Signal amplitude is too weak to be analyzed or to be perceived by humans. MATLAB error.
- F03-1: Signal amplitude is too weak to be analyzed or to be perceived by humans. PRR value is smaller than zero (< 0).
- F03-2: Signal amplitude is too weak to be analyzed or to be perceived by humans. Amplitude value is smaller than 0.1 (< 0.1).
- F04: The first acceleration phase is missing. No signal for the first half.
- F05: No increased acceleration between two phases. The max amplitude of acceleration 1 and acceleration 2 is almost identical.
Android version required for the hardware assessment: Android 10.0 (API level 29) or higher.
Android version used to populate the performance map: Android 8.0 (API level 26) or higher. For Effect 1,
HapticFeedbackConstants.KEYBOARD_PRESSwas used instead ofVibrationEffect.EFFECT_CLICKbecause the data acquisition was performed prior to the introduction of the Haptics implementation checklist.
Performance map for EFFECT_CLICK (Effect 1)
| About the performance map for EFFECT_CLICK (Effect 1) | |||||||
|---|---|---|---|---|---|---|---|
| Effect definition (Java) | Vibrator vibrator = getSystemService(Vibrator.class); vibrator.vibrate(VibrationEffect.createPredefined(EFFECT_CLICK)); |
||||||
| Effect definition (Kotlin) | val vibrator = getSystemService(Vibrator::class.java) vibrator.vibrate(VibrationEffect.createPredefined(EFFECT_CLICK)) |
||||||
| Data required to read the performance map |
|
||||||
| Pass rate |
|
||||||
| Data to populate the performance map for EFFECT_CLICK (Effect 1) | |||||||
|---|---|---|---|---|---|---|---|
| Device ID | Price tier | Actuator type | Pass/fail | Peak duration (ms) | Peak amplitude (g) | PRR | FOMS |
| #101 | High | X-LRA | Pass | 167.33 | 0.53 | 20.91 | 0.12 |
| #102 | High | X-LRA | Pass | 20.63 | 1.07 | 20.09 | 0.97 |
| #103 | High | X-LRA | Pass | 19.98 | 0.98 | 21.75 | 1.09 |
| #104 | High | X-LRA | Pass | 22.67 | 1.16 | 20.02 | 0.88 |
| #105 | High | X-LRA | Pass | 10.96 | 1.30 | 23.62 | 2.16 |
| #106 | High | Z-LRA | Pass | 20.13 | 1.11 | 24.15 | 1.20 |
| #107 | High | Z-LRA | Pass | 49.31 | 0.79 | 20.06 | 0.41 |
| #108 | High | X-LRA | Pass | 120.71 | 0.24 | 14.93 | 0.12 |
| #109 | High | Z-LRA | Pass | 51.46 | 0.43 | 8.69 | 0.17 |
| #110 | High | X-LRA | Pass | 8.44 | 1.01 | 27.68 | 3.28 |
| #111 | High | ERM | Fail (F01) | n/a | n/a | n/a | n/a |
| #112 | High | Z-LRA | Pass | 25.85 | 0.51 | 21.94 | 0.85 |
| #113 | High | Z-LRA | Pass | 58.35 | 0.29 | 25.10 | 0.43 |
| #114 | High | Z-LRA | Pass | 34.46 | 0.28 | 20.91 | 0.61 |
| #115 | High | Z-LRA | Pass | 23.67 | 0.31 | 26.46 | 1.12 |
| #116 | High | X-LRA | Pass | 8.40 | 0.44 | 29.82 | 3.55 |
| #117 | High | Z-LRA | Pass | 31.35 | 1.13 | 23.65 | 0.75 |
| #118 | Medium | Z-LRA | Pass | 26.42 | 0.42 | 25.05 | 0.95 |
| #119 | Medium | Z-LRA | Pass | 30.65 | 0.48 | 19.69 | 0.64 |
| #120 | Medium | Z-LRA | Pass | 170.65 | 0.97 | 20.16 | 0.12 |
| #121 | Medium | Z-LRA | Pass | 51.69 | 0.55 | 17.14 | 0.33 |
| #122 | Medium | X-LRA | Fail (F01) | n/a | n/a | n/a | n/a |
| #123 | Low | ERM | Fail (F01) | n/a | n/a | n/a | n/a |
| #124 | Low | ERM | Pass | 68.33 | 0.93 | 7.40 | 0.11 |
| #125 | Low | ERM | Fail (F01) | n/a | n/a | n/a | n/a |
| #126 | Low | Z-LRA | Pass | 41.96 | 0.68 | 8.77 | 0.21 |
| #127 | Low | Z-LRA | Pass | 9.63 | 0.43 | 4.55 | 0.47 |
| #128 | Low | Z-LRA | Pass | 22.77 | 0.55 | 26.10 | 1.15 |
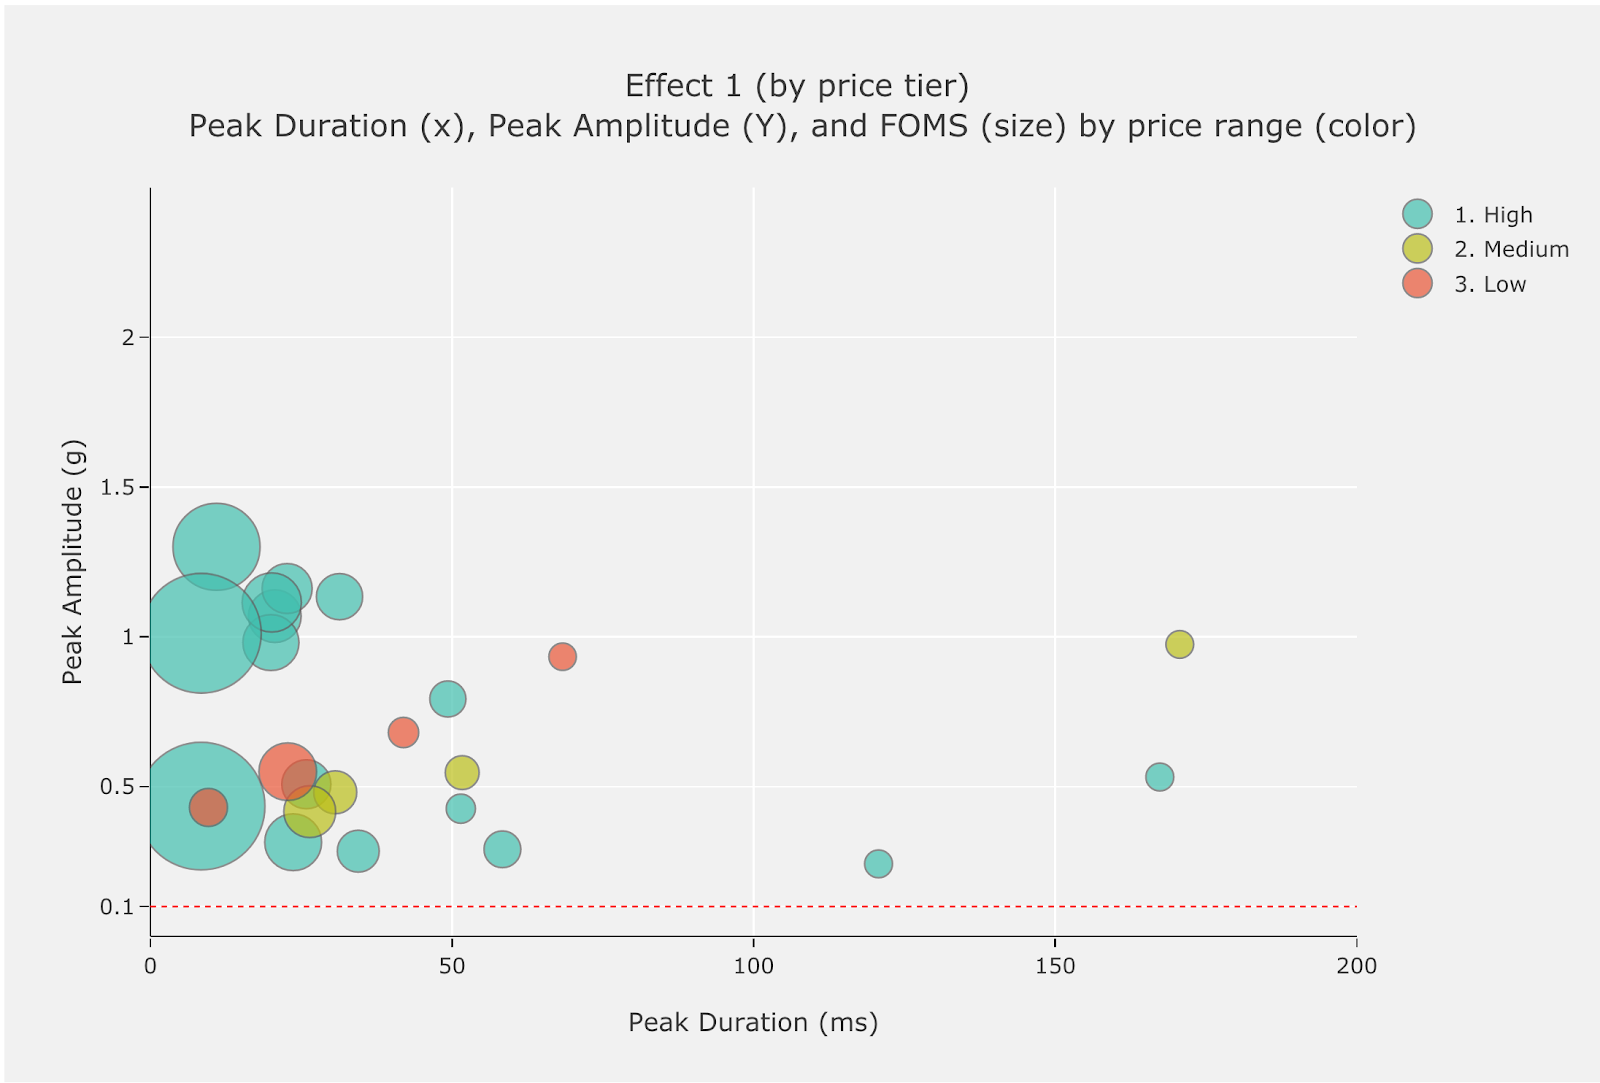
Figure 4. Performance map for Effect 1 (by price tier)
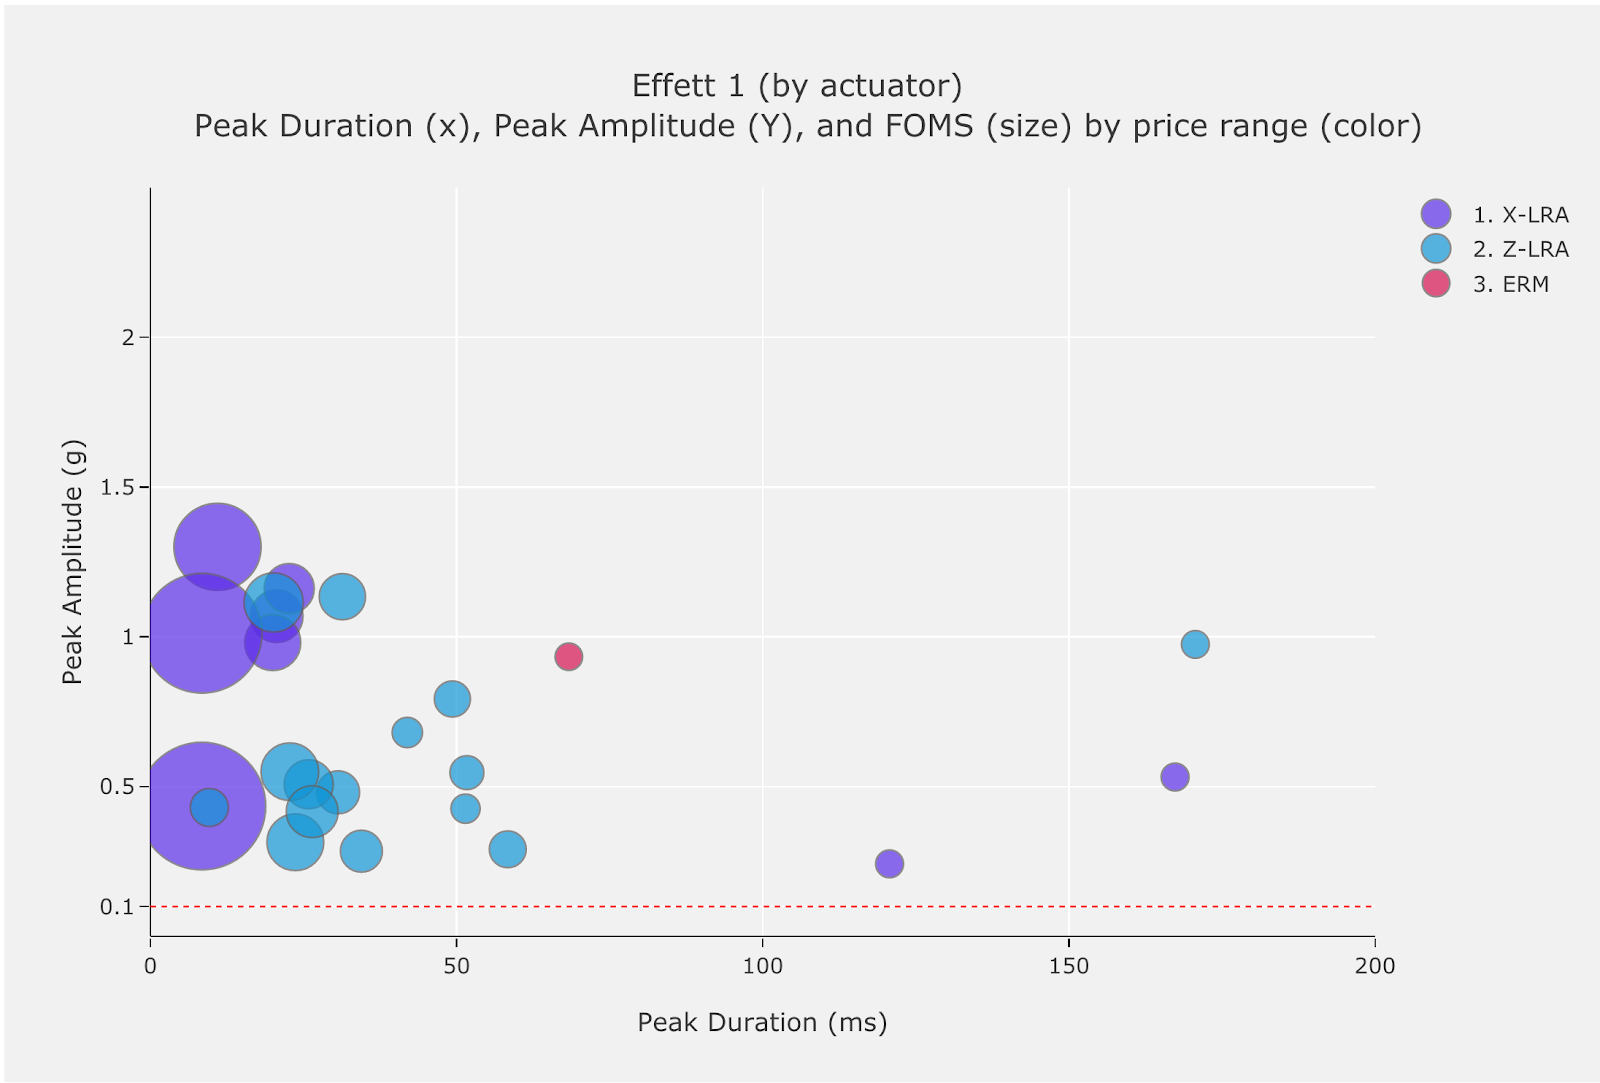
Figure 5. Performance map for Effect 1 (by actuator type)
Performance map for createOneShot (Effect 2)
| About the performance map for createOneShot (Effect 2) | |||||||
|---|---|---|---|---|---|---|---|
| Effect definition (Java) | private static final long oneShotTiming = 20; private static final int oneShotAmplitude = 255; |
||||||
| Effect definition (Kotlin) | private val oneShotTiming: Long = 20 private val oneShotAmplitude = 255 |
||||||
| Data required to read the performance map |
|
||||||
| Pass rate |
|
||||||
| Data to populate the performance table for createOneShot (Effect 2) | |||||||
|---|---|---|---|---|---|---|---|
| Device ID | Price tier | Actuator type | Pass/fail | Peak duration (ms) | Peak amplitude (g) | PRR | FOMS |
| #201 | High | X-LRA | Pass | 168.81 | 0.98 | 20.62 | 0.12 |
| #202 | High | X-LRA | Pass | 28.35 | 2.29 | 28.95 | 1.02 |
| #203 | High | X-LRA | Pass | 77.25 | 0.78 | 21.01 | 0.27 |
| #204 | High | X-LRA | Pass | 70.48 | 1.42 | 21.85 | 0.31 |
| #205 | High | X-LRA | Pass | 67.92 | 1.19 | 22.61 | 0.33 |
| #206 | High | Z-LRA | Pass | 33.44 | 1.34 | 25.19 | 0.75 |
| #207 | High | Z-LRA | Pass | 73.90 | 1.36 | 23.13 | 0.31 |
| #208 | High | X-LRA | Pass | 102.02 | 0.71 | 20.12 | 0.20 |
| #209 | High | Z-LRA | Pass | 63.71 | 0.14 | 3.70 | 0.06 |
| #210 | High | X-LRA | Pass | 8.46 | 1.01 | 28.77 | 3.40 |
| #211 | High | ERM | Fail (F02, F03-1) | n/a | n/a | n/a | n/a |
| #212 | High | Z-LRA | Pass | 43.71 | 1.03 | 23.14 | 0.53 |
| #213 | High | Z-LRA | Pass | 27.42 | 0.23 | 22.85 | 0.83 |
| #214 | High | Z-LRA | Pass | 45.29 | 0.72 | 19.99 | 0.44 |
| #215 | High | Z-LRA | Pass | 23.71 | 0.41 | 27.30 | 1.15 |
| #216 | High | X-LRA | Pass | 8.31 | 0.43 | 27.58 | 3.32 |
| #217 | High | Z-LRA | Pass | 42.19 | 1.03 | 26.97 | 0.64 |
| #218 | Medium | Z-LRA | Pass | 26.38 | 0.42 | 24.74 | 0.94 |
| #219 | Medium | Z-LRA | Pass | 46.77 | 1.01 | 24.64 | 0.53 |
| #220 | Medium | Z-LRA | Pass | 166.33 | 0.97 | 20.61 | 0.12 |
| #221 | Medium | Z-LRA | Pass | 38.60 | 0.42 | 18.21 | 0.47 |
| #222 | Medium | X-LRA | Pass | 76.00 | 0.61 | 23.17 | 0.30 |
| #223 | Low | ERM | Fail (F03-2) | 55.27 | 0.08 | 1.95 | 0.04 |
| #224 | Low | ERM | Pass | 39.29 | 0.30 | 7.04 | 0.18 |
| #225 | Low | ERM | Fail (F03) | n/a | n/a | n/a | n/a |
| #226 | Low | Z-LRA | Pass | 34.31 | 0.53 | 30.23 | 0.88 |
| #227 | Low | Z-LRA | Pass | 5.42 | 0.37 | 12.23 | 2.26 |
| #228 | Low | Z-LRA | Pass | 22.65 | 0.90 | 24.23 | 1.07 |
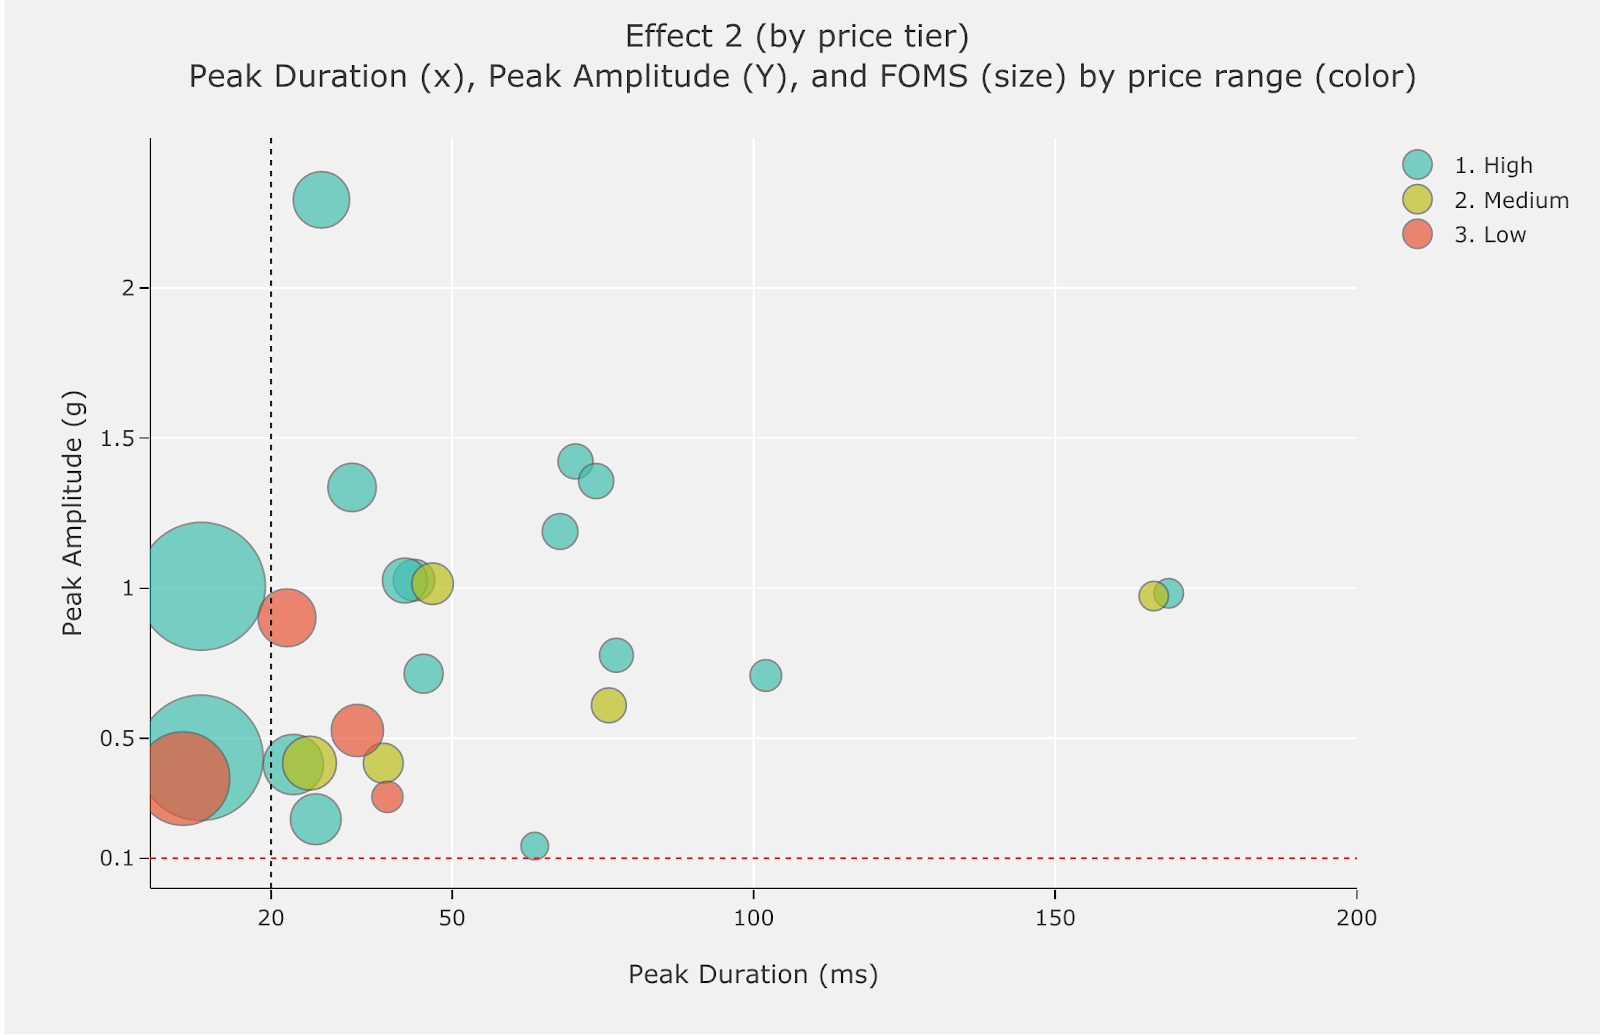
Figure 6. Performance map for Effect 2 (by price tier)
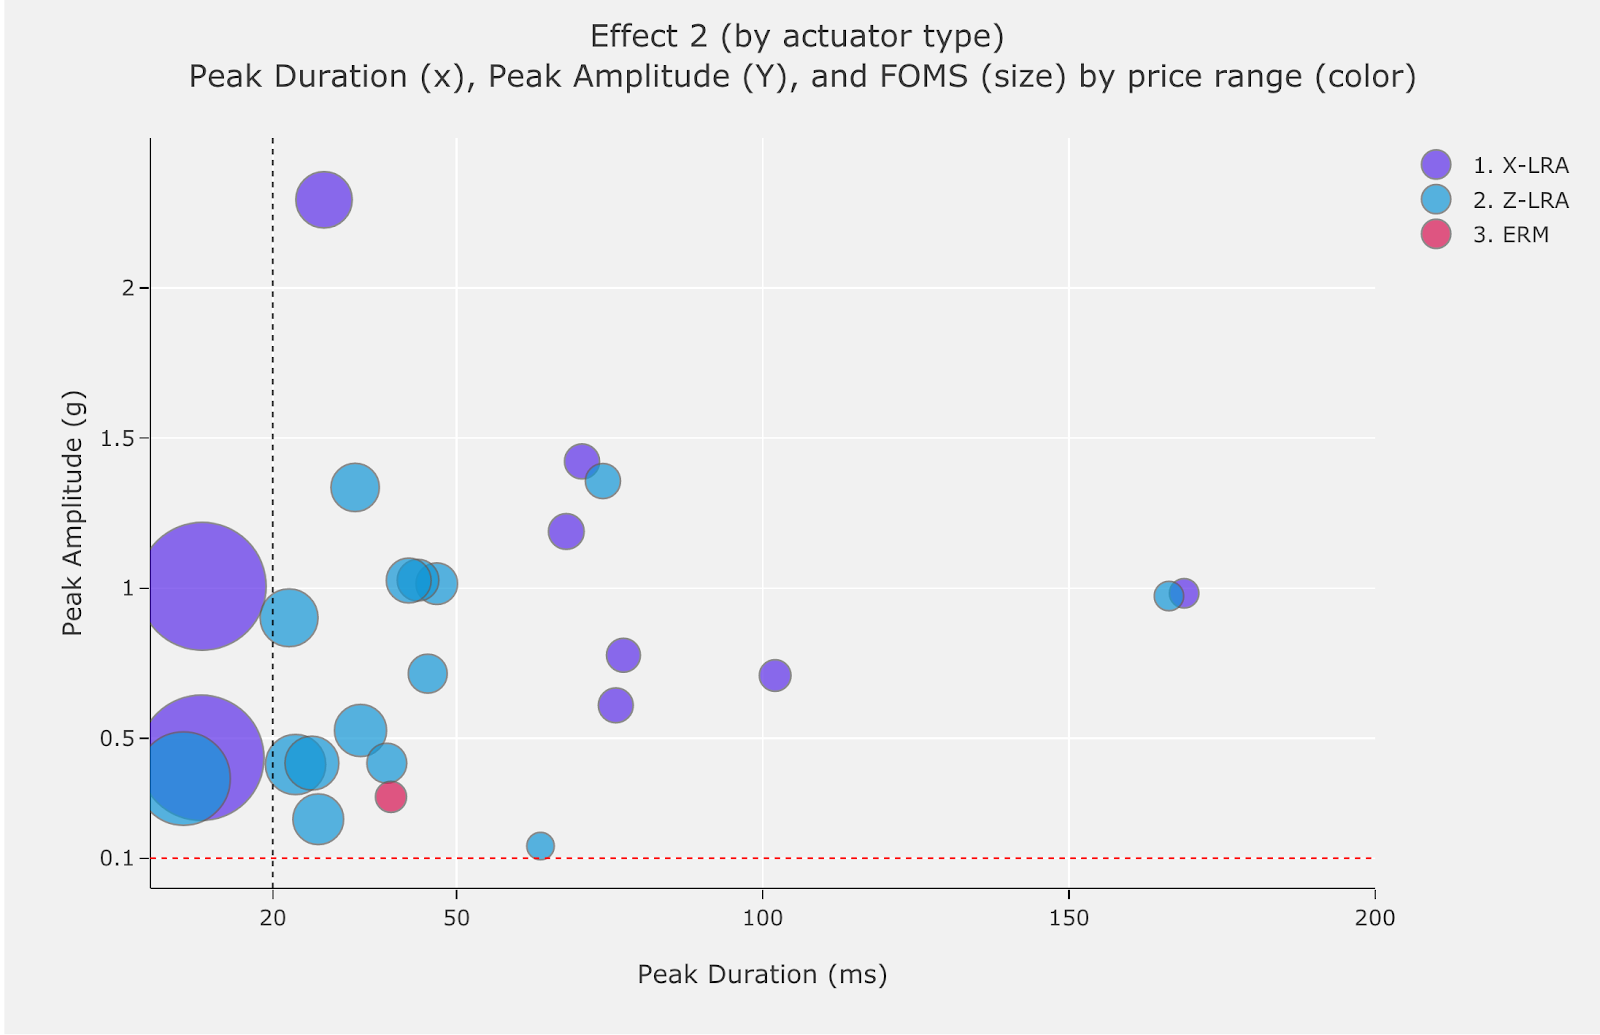
Figure 7. Performance map for Effect 2 (by actuator type)
Performance map for createWaveform (Effect 3)
| About the performance map for createWaveform (Effect 3) | |||||||
|---|---|---|---|---|---|---|---|
| Effect definition (Java) |
private static final long[] waveformTimings = {500, 500};
private static final int[] waveformAmplitudes = {128, 255};
|
||||||
| Effect definition (Kotlin) | private val waveformTimings = longArrayOf(500, 500) private val waveformAmplitudes = intArrayOf(128, 255) |
||||||
| Data required to read the performance map |
|
||||||
| Pass rate |
|
||||||
| Data to populate the performance table for createWaveform (Effect 3) | |||||||
|---|---|---|---|---|---|---|---|
| Device ID | Price tier | Actuator type | Pass/fail | Acceleration 1 (50%) | Acceleration 2 (100%) | Acceleration ratio | Delta |
| #301 | High | X-LRA | Pass | 1.19 | 2.02 | 1.70 | 0.83 |
| #302 | High | X-LRA | Pass | 0.87 | 1.85 | 2.12 | 0.98 |
| #303 | High | X-LRA | Pass | 0.62 | 1.47 | 2.37 | 0.85 |
| #304 | High | X-LRA | Pass | 0.82 | 1.89 | 2.30 | 1.07 |
| #305 | High | X-LRA | Pass | 0.69 | 1.51 | 2.21 | 0.83 |
| #306 | High | Z-LRA | Pass | 1.02 | 1.50 | 1.46 | 0.47 |
| #307 | High | X-LRA | Pass | 0.59 | 1.37 | 2.32 | 0.78 |
| #308 | High | Z-LRA | Pass | 0.58 | 0.72 | 1.25 | 0.14 |
| #309 | Medium | Z-LRA | Pass | 0.39 | 1.43 | 3.66 | 1.04 |
| #310 | High | X-LRA | Fail (F04) | 0.00 | 1.36 | 1.36 | 1.36 |
| #311 | High | X-LRA | Fail (F04) | 0.00 | 0.56 | 0.56 | 0.56 |
| #312 | Medium | Z-LRA | Fail (F04) | 0.00 | 0.71 | 0.71 | 0.71 |
| #313 | High | Z-LRA | Fail (F05) | 0.60 | 0.61 | 1.02 | 0.01 |
| #314 | High | Z-LRA | Fail (F05) | 0.64 | 0.65 | 1.01 | 0.01 |
| #315 | High | ERM | Fail (F05) | 0.96 | 0.95 | 0.99 | -0.01 |
| #316 | High | Z-LRA | Fail (F05) | 0.40 | 0.40 | 1.00 | 0.00 |
| #317 | High | Z-LRA | Fail (F05) | 0.60 | 0.58 | 0.98 | -0.01 |
| #318 | High | Z-LRA | Fail (F05) | 0.30 | 0.30 | 1.00 | 0.00 |
| #319 | High | Z-LRA | Fail (F05) | 0.57 | 0.56 | 0.99 | 0.00 |
| #320 | Medium | Z-LRA | Fail (F05) | 0.67 | 0.67 | 1.00 | 0.00 |
| #321 | Medium | Z-LRA | Fail (F05) | 0.67 | 0.66 | 0.99 | -0.01 |
| #322 | Medium | X-LRA | Fail (F05) | 0.95 | 1.02 | 1.07 | 0.06 |
| #323 | Low | ERM | Fail (F05) | 0.86 | 0.88 | 1.01 | 0.01 |
| #324 | Low | ERM | Fail (F05) | 1.46 | 1.45 | 0.99 | -0.01 |
| #325 | Low | ERM | Fail (F05) | 0.95 | 0.96 | 1.01 | 0.01 |
| #326 | Low | Z-LRA | Fail (F05) | 0.90 | 0.92 | 1.02 | 0.02 |
| #327 | Low | Z-LRA | Fail (F05) | 0.47 | 0.47 | 1.00 | 0.00 |
| #328 | Low | Z-LRA | Fail (F05) | 0.51 | 0.56 | 1.09 | 0.04 |
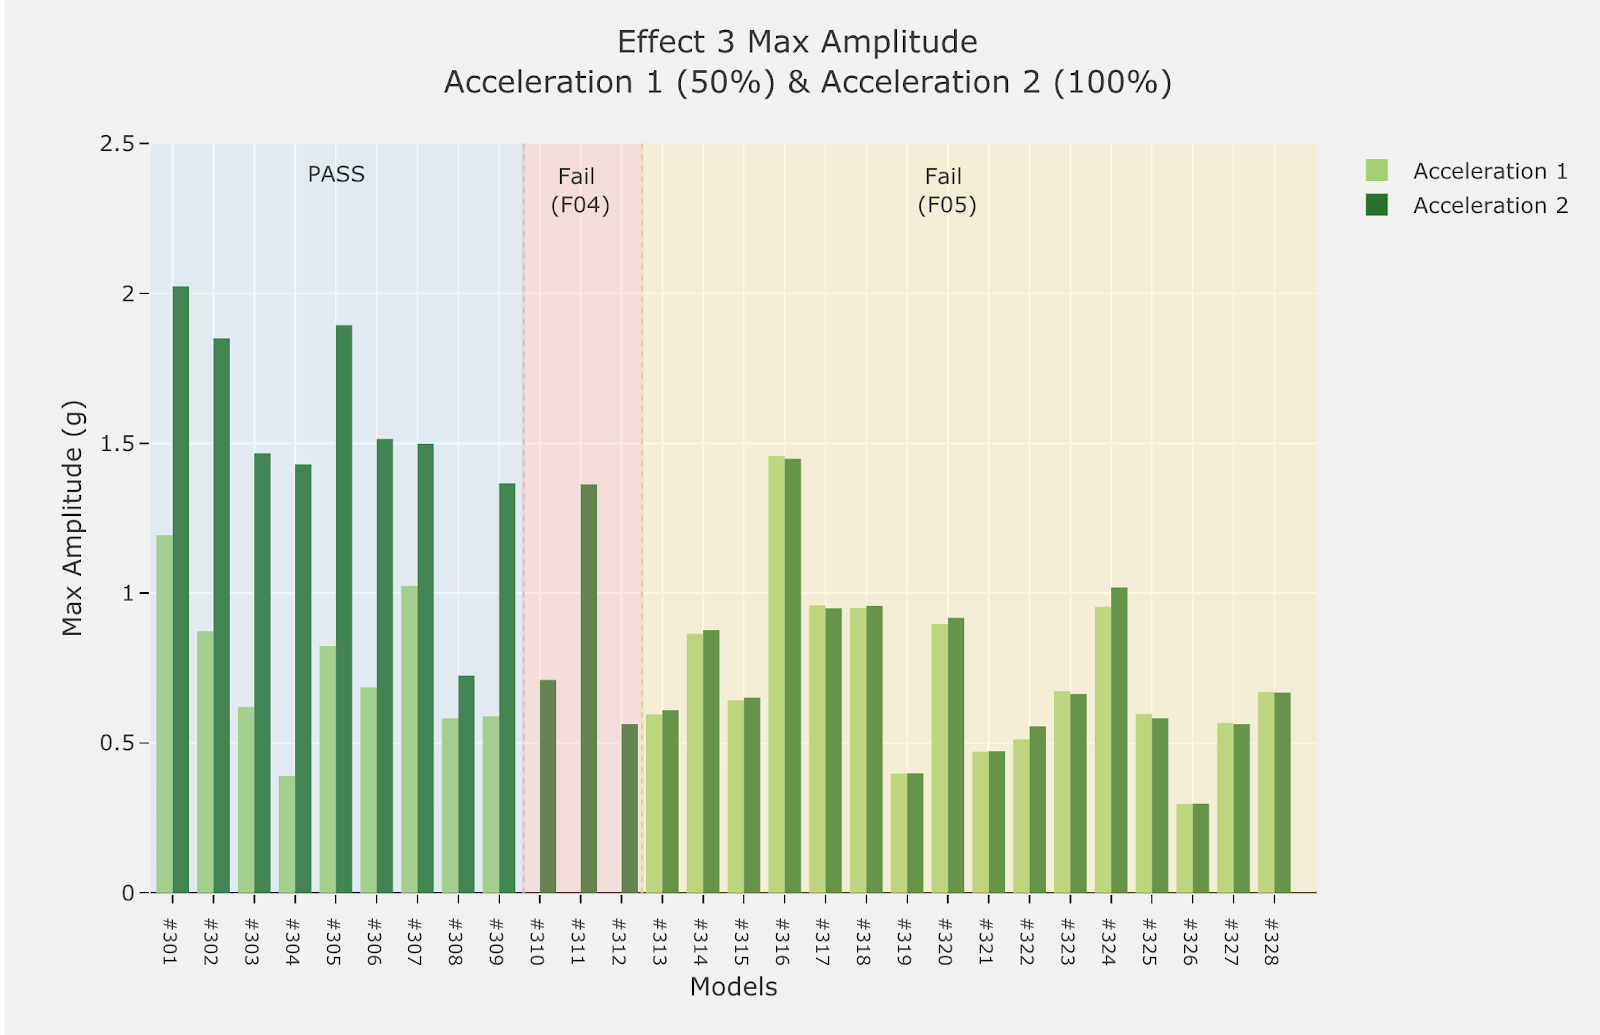
Figure 8. Performance map for Effect 3 (by pass/fail)
