
MATLAB 파일을 다운로드하고 실행한 후 다음 순서도를 사용하여 이전 단계에서 녹음된 파형 파일을 분석합니다.
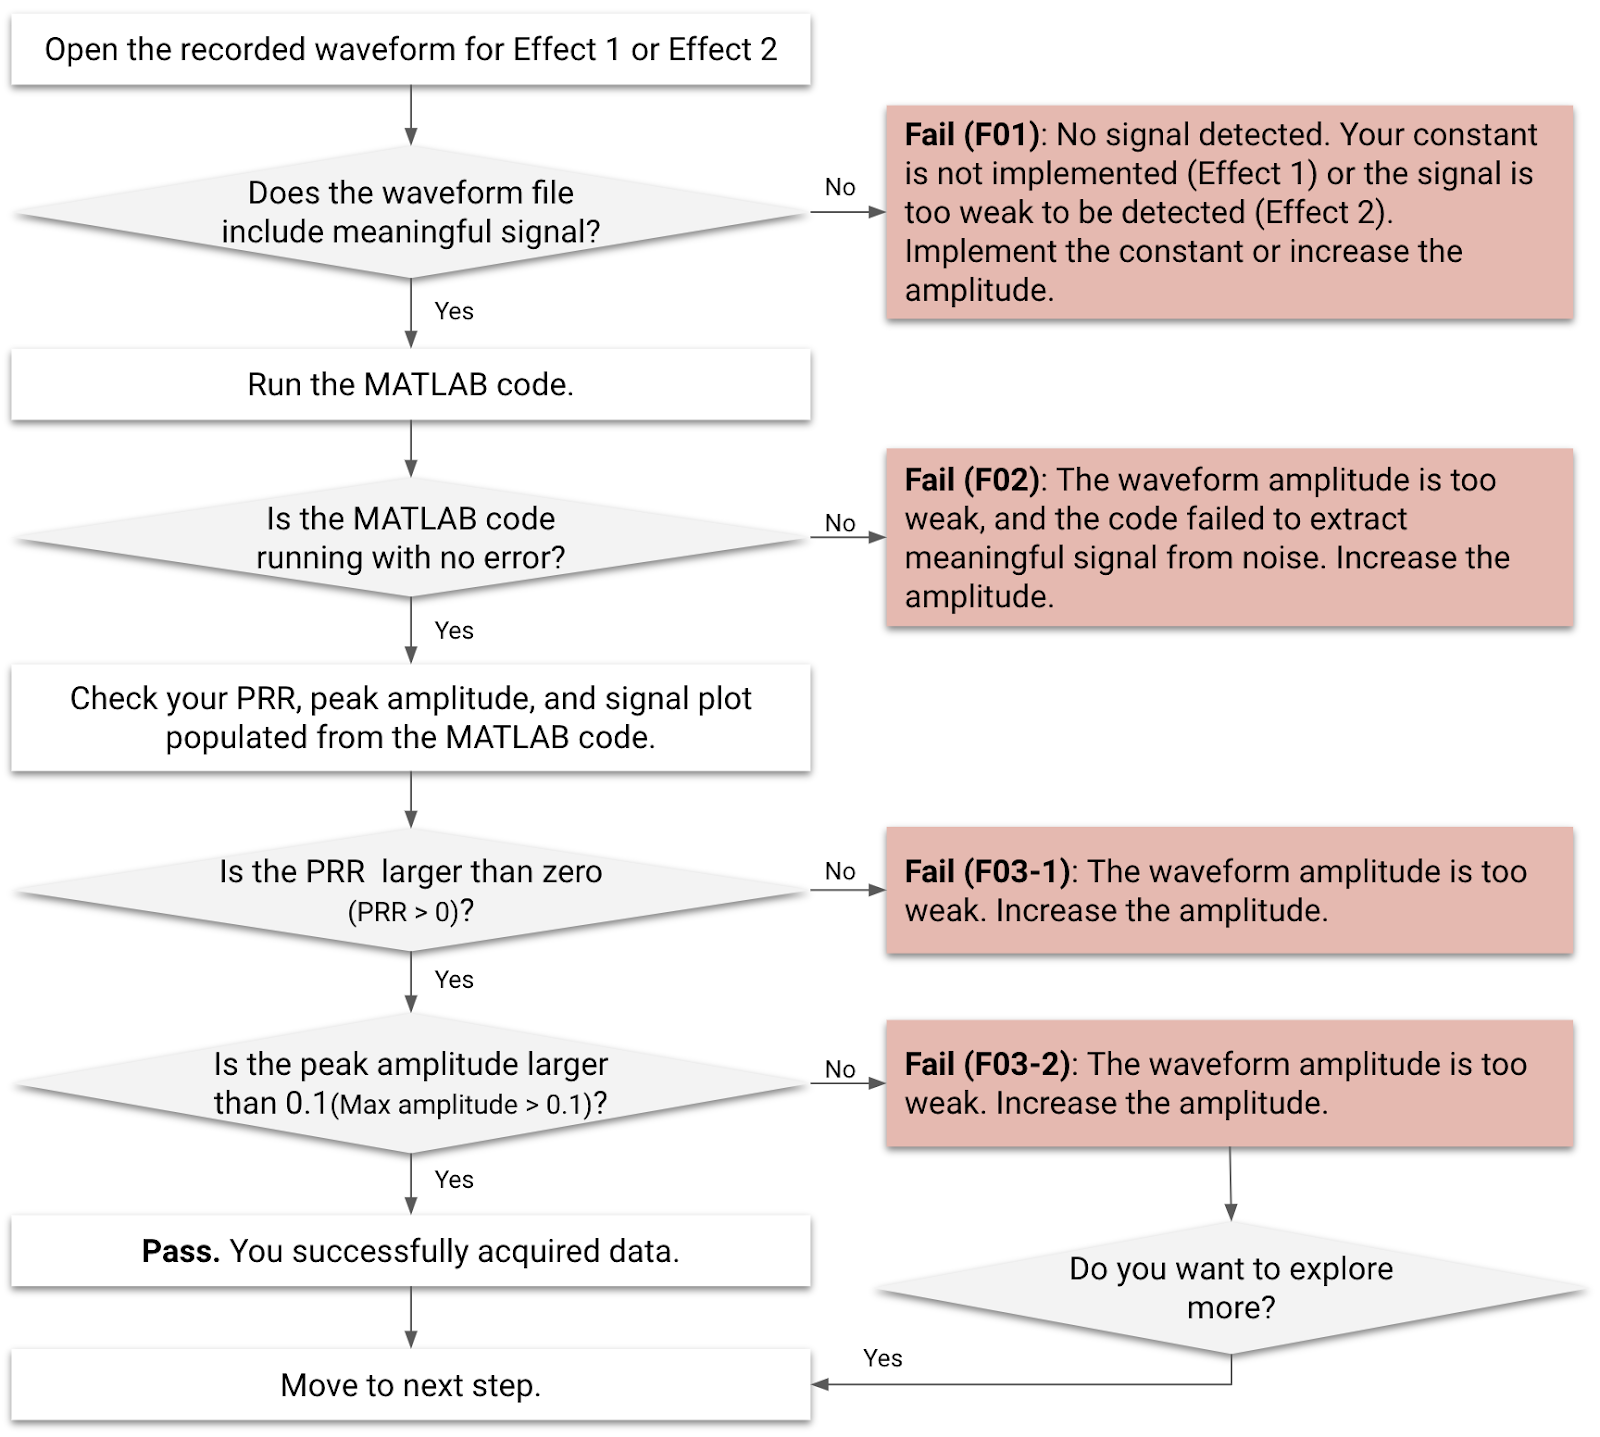
그림 1. 효과 1 및 효과 2의 파형 분석 흐름도
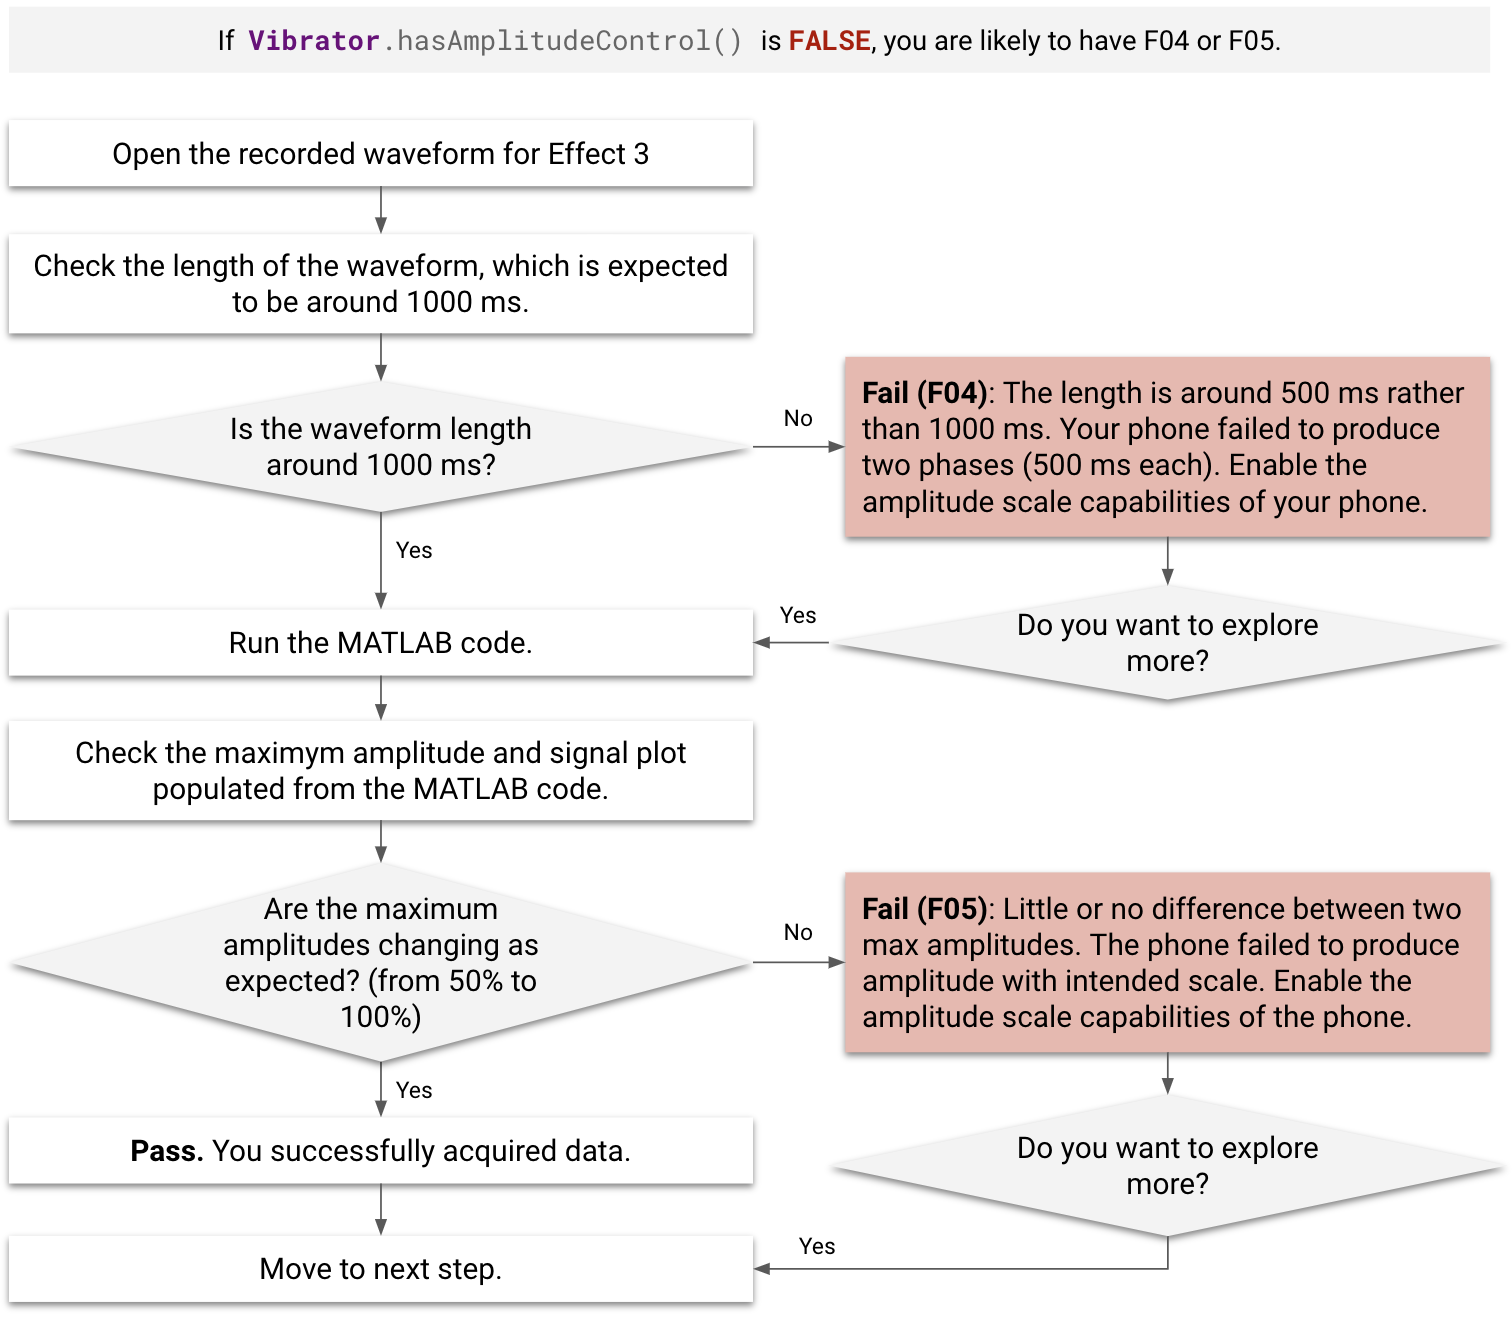
그림 2. 효과 3의 파형 분석 흐름도
실패 사례
분석 전후에 실패 사례 (F01~F05)를 확인합니다.
- F01 및 F02로 지정된 효과는 MATLAB 코드로 처리할 수 없습니다.
- F03-1로 지정된 효과는 오류 없이 MATLAB 코드로 처리되더라도 성능 지도에 추가할 수 없습니다.
- F03-2, F04, F05로 지정된 효과는 처리 실패에도 불구하고 성능 지도에 추가할 수 있습니다.
Vibrator.hasAmplitudeControl()이false를 반환하면 DUT는 F04 또는 F05로 지정됩니다.- 측정 중에 효과 3 버튼을 클릭한 후 눈에 띄는 지연 (500ms 이상)이 있으면 DUT에 F04 지정이 부여됩니다.
| 실패 코드 | 실패 설명 | 적용 가능한 효과 | 실패 이유 | 실패 수정 |
|---|---|---|---|---|
| F01 | 출력 신호가 기록되지 않습니다. | 효과 1 | 햅틱 반응 상수가 구현되지 않았습니다. | 상수 구현에 설명된 대로 빈 상수를 구현합니다. |
| F02 | MATLAB 코드 오류입니다. MATLAB 오류의 예는 다음과 같습니다. Index exceeds matrix dimensions. |
효과 1, 효과 2 | 햅틱 효과의 진폭이 너무 약합니다. | 햅틱 효과의 진폭을 늘립니다. |
| F03-1, F03-2 | [F03-1] MATLAB 오류는 없지만 MATLAB 코드에서 채워진 PRR이 0보다 작습니다. [F03-2] MATLAB 오류는 없지만 MATLAB 코드에서 채워진 진폭이 0.1g보다 작습니다. |
효과 1, 효과 2 | 햅틱 효과의 진폭이 너무 약합니다. | 햅틱 효과의 진폭을 늘립니다. |
| F04 | 신호가 너무 짧습니다 (1,000ms가 아닌 약 500ms). | 효과 3 | 기기가 스케일링된 진폭을 제대로 생성하지 못합니다. 50% 진폭이 호출되었지만 첫 500ms 단계 진폭은 0% 진폭으로 생성됩니다. | 진폭 스케일 기능을 사용 설정합니다. |
| F05 | 두 최대 진폭 값은 차이가 거의 없거나 전혀 없습니다. | 효과 3 | 기기가 스케일링된 진폭을 제대로 생성하지 못합니다. | 진폭 스케일 기능을 사용 설정합니다. |
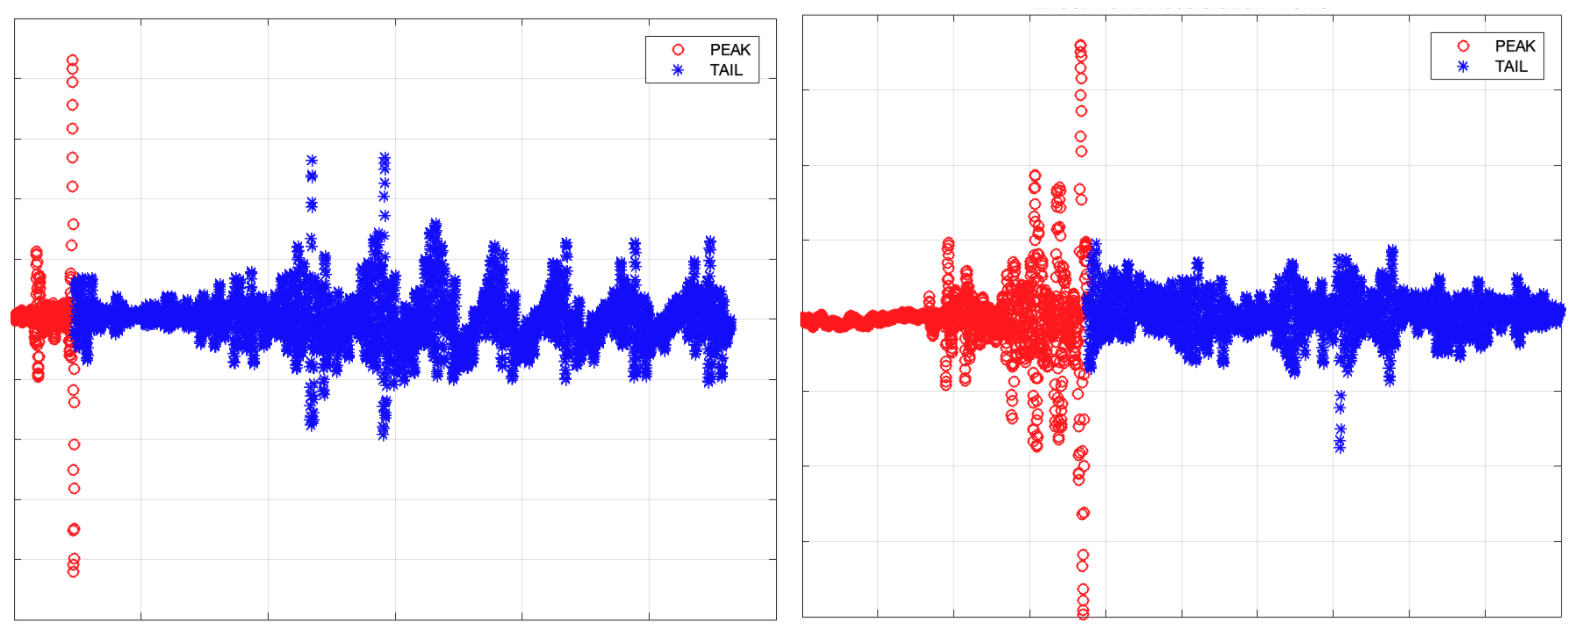
그림 3. F03-1 (왼쪽) 및 F03-2 (오른쪽)의 MATLAB 신호 플롯 예
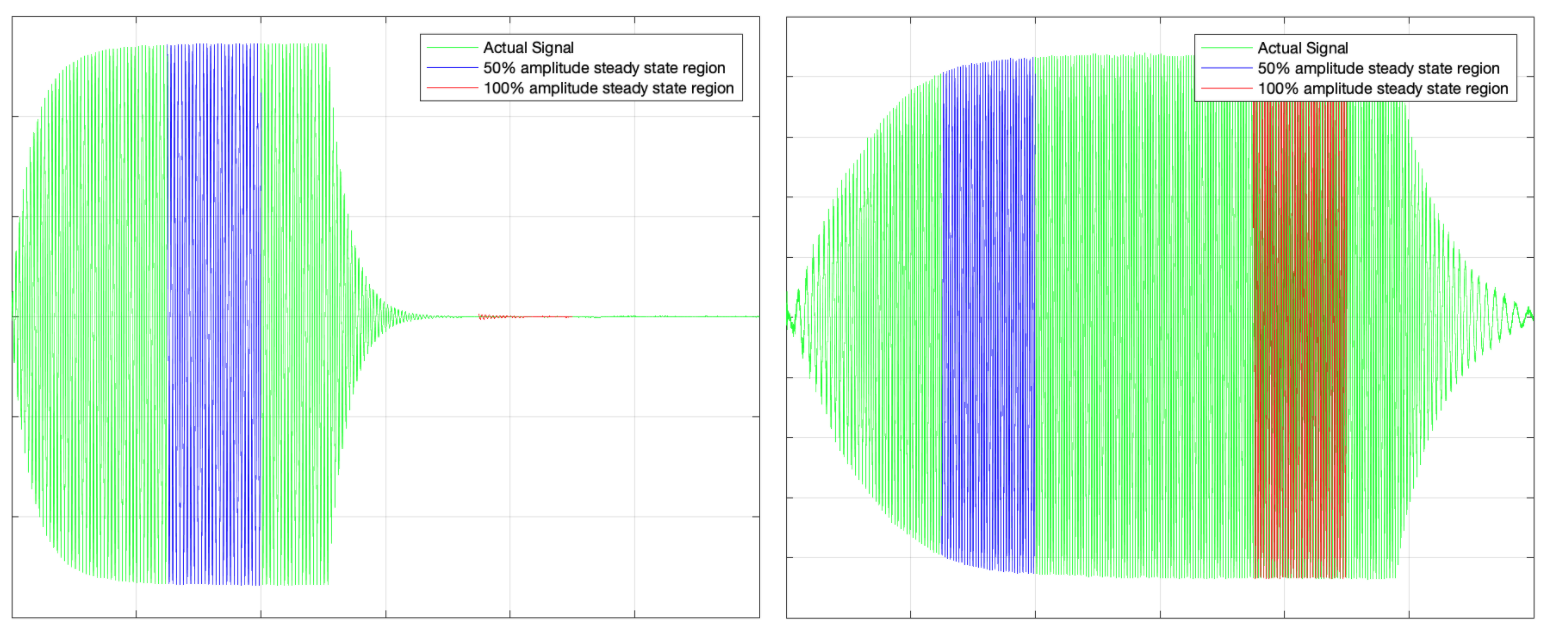
그림 4. F04 (왼쪽) 및 F05 (오른쪽)의 MATLAB 신호 플롯 예
분석에서 데이터 획득
각 효과에 대해 MATLAB 코드를 실행할 때 MATLAB 소프트웨어의 명령 창에 표시된 결과를 읽을 수 있습니다.
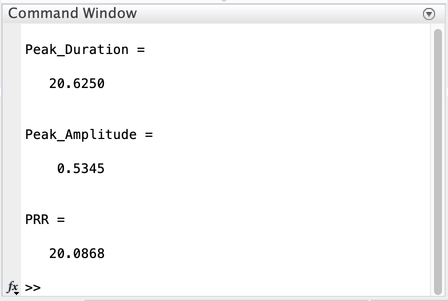
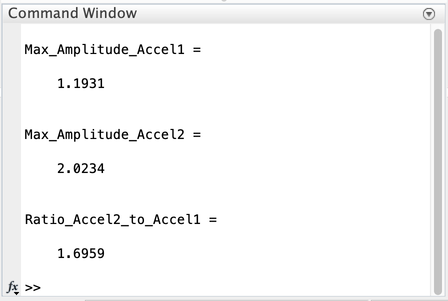
그림 5. 명령 창의 MATLAB 결과 예시, 효과 1 (첫 번째) 및 효과 3 (두 번째)
효과 1 및 효과 2 (짧은 임펄스)
- 최고 기간 (밀리초)
- 최대 진폭 (g)
- 선명도 측정항목 수치를 계산하는 PRR (FOMS = PRR/최고 지속 시간)
효과 3 (긴 진동)
- 2단계의 최대 진폭 (g)
성능 지도를 사용하여 결과 비교에는 Android 생태계의 대표 기기에서 획득한 동일한 데이터 세트가 포함되어 있으므로 이에 따라 성능 지도를 채울 수 있습니다. 이를 통해 전체 생태계를 파악하고 비교를 위해 데이터를 실적 지도 데이터와 정렬할 수 있습니다.
다음 표를 사용하여 DUT를 Android 생태계의 다른 휴대전화나 태블릿과 비교해 보세요. 이 개념을 중심으로 구성된 구체적인 질문은 다음과 같습니다. 즉, 가격대와 같은 특성이 비슷한 다른 Android 휴대전화와 비교했을 때 내 휴대전화의 성능이 다른 휴대전화보다 더 나은가요, 아니면 더 나쁜가요?
| [입력] 분석할 효과 |
[출력] 최고/최대 진폭 (G) |
[출력] 최대 지속 시간 (밀리초) | [출력] 펄스 대 벨소리 비율 (PRR) |
|---|---|---|---|
효과 1: 사전 정의된 햅틱 상수(VibrationEffect.EFFECT_CLICK) |
[1] 데이터 1-1 | [2] 데이터 1~2 | [3] 데이터 1~3 |
| 효과 2: 짧은 맞춤 햅틱 효과 (지속 시간 = 20ms, 진폭 = 100%) | [4] Data 2-1 | [5] 데이터 2-2 | [6] 데이터 2~3 |
| 효과 3-1: 처음 500ms 동안 진폭이 50%인 긴 맞춤 햅틱 효과 가속 단계 1 | [7] 데이터 3-1 | 해당 사항 없음 | 해당 사항 없음 |
| 효과 3-2: 두 번째 500ms 동안 진폭이 100%인 긴 맞춤 햅틱 효과 가속 단계 2 | [8] 데이터 3-2 | 해당 사항 없음 | 해당 사항 없음 |
효과 1과 효과 2의 벨소리 비율 및 최대 진폭
효과 1과 효과 2에서 측정되는 두 가지 주요 매개변수는 펄스 대 링 비율(PRR)과 최고 진폭입니다. 이러한 매개변수는 가속도계 설정에서 측정한 가속도를 기반으로 합니다.
PRR은 메인 펄스와 벨소리 진폭의 비율을 사용하여 계산됩니다. 기간은 기본 펄스의 경과 시간입니다. PRR 공식은 다음과 같습니다.
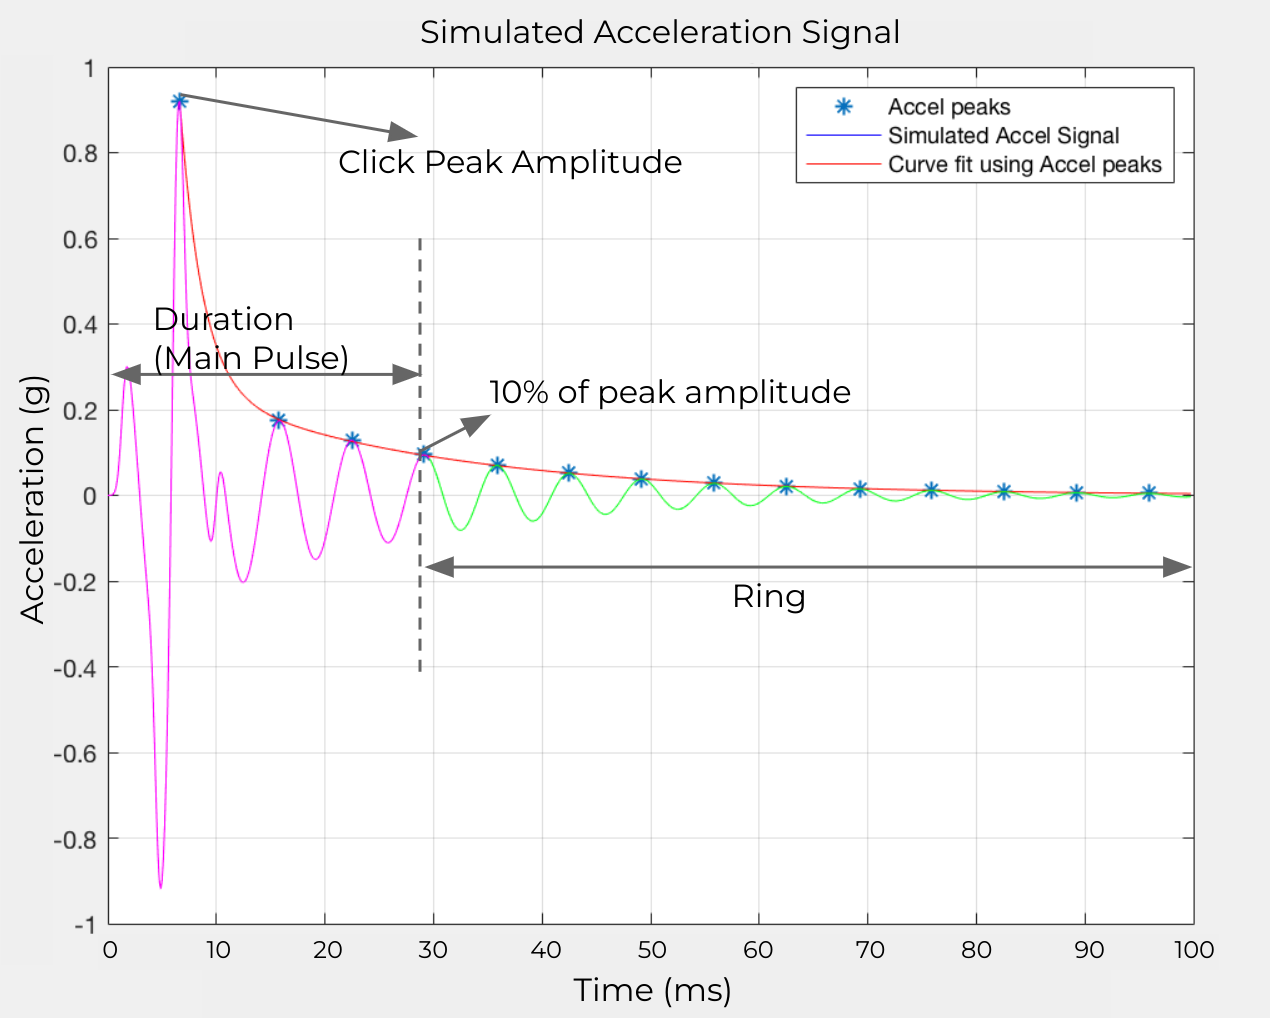
그림 6. 시뮬레이션된 가속 신호
이러한 요소는 그림 6에 나와 있습니다.
- 메인 펄스: 진폭이 최대 진폭의 10% 로 감소하는 지속 시간 창 내의 신호로 정의됩니다.
링 시간: 진폭이 최대 진폭의 10% 에서 최대 진폭의 1% 미만으로 감소하는 신호로 정의됩니다.
PRR 및 지속 시간 계산: 각 가속 기간의 최고점을 사용하는 곡선 적합을 만듭니다. 곡선 피팅은 노이즈 효과를 최소화하여 테스트 반복성을 개선하므로 이 작업을 수행하는 데 가장 적합한 방법입니다.
효과 3의 최대 진폭
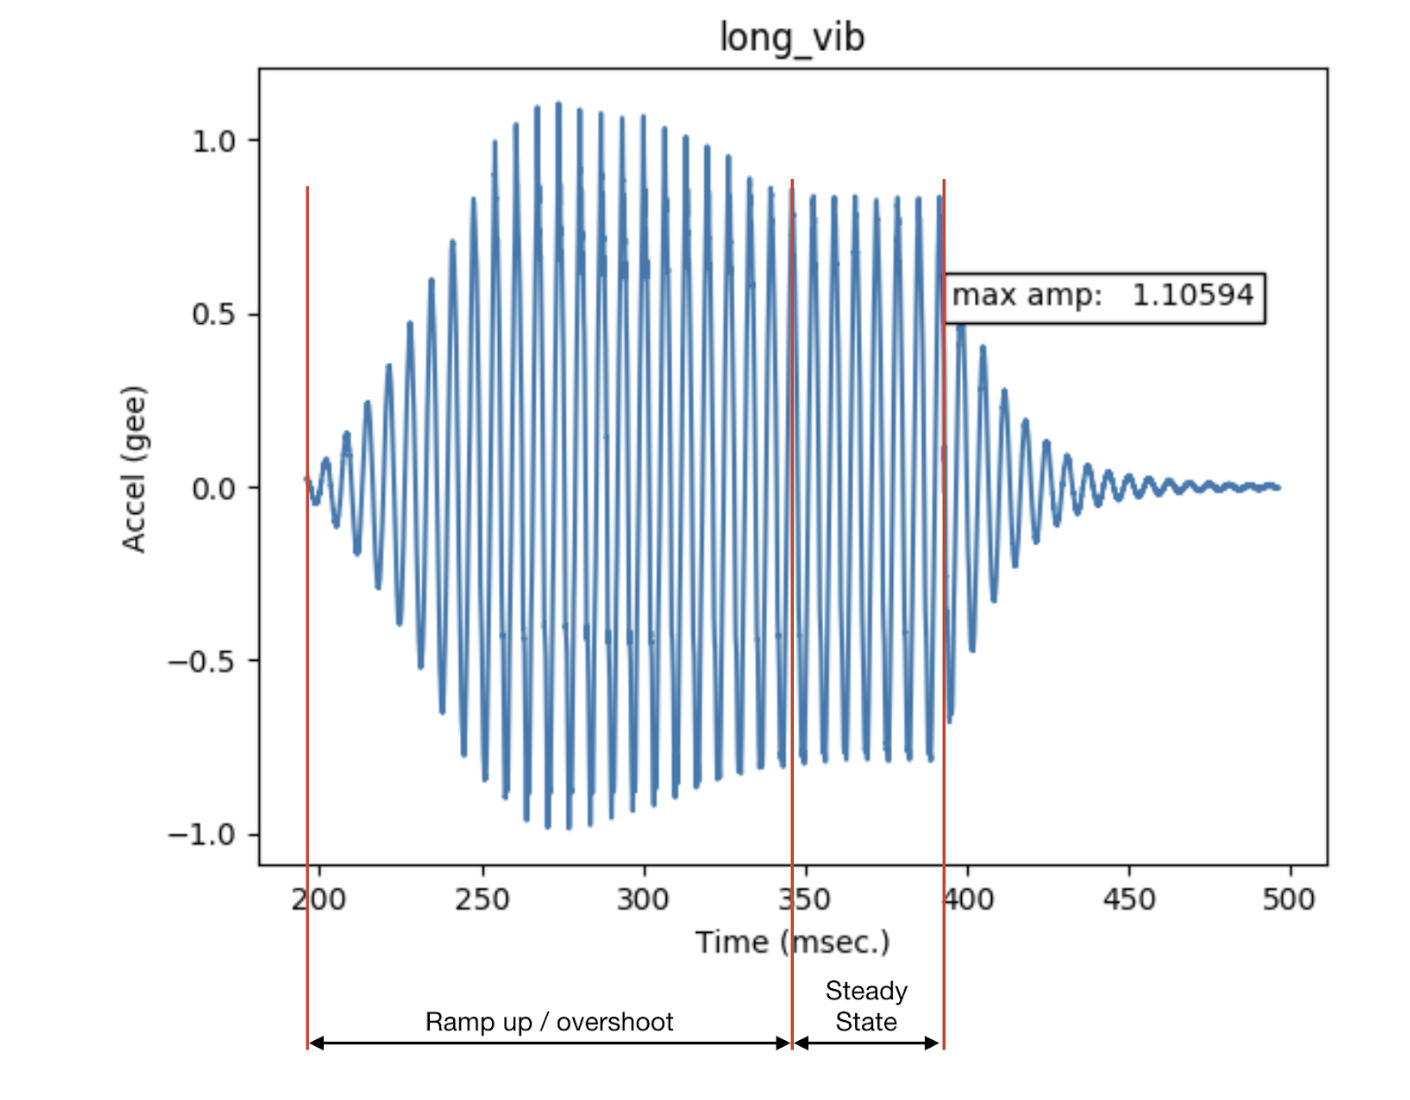
그림 7. 액추에이터 오버슈트
이러한 요소는 그림 7에 나와 있습니다.
- 긴 진동
- 공진 주파수에서 사인파 입력이 적용될 때 선형 공진 액추에이터의 출력입니다.
- 최대 진폭
- 기기 진동이 정상 상태일 때 긴 진동의 최대 진폭입니다.
- 오버슈트
- 오버슈트는 액추에이터가 공진에서 멀어질 때 발생합니다. 이 그림은 진동기가 사인파 입력으로 공진에서 벗어날 때 발생하는 동작 유형을 보여줍니다. 이것이 바로 극단적인 오버슈트의 예입니다.
- LRA가 공진 주파수에서 구동되면 오버슈트가 거의 또는 전혀 관찰되지 않습니다. LRA의 일반적인 공진 주파수는 50~250Hz입니다.