
This page provides detailed instructions for collecting Perfetto traces to use with Wattson and for analyzing the resulting power data in the Perfetto UI.
While there are many ways to collect a Perfetto trace, the methods on this page include the specific requirements and workflows for generating a trace compatible with Wattson.
Minimum build requirements
To verify that Wattson has the required metadata to function correctly, you must collect traces from a device running a recent build. The minimum build versions for CPU and GPU power estimation vary by device.
| Device | Minimum build requirement: CPU estimation | Minimum build requirement: GPU estimation |
|---|---|---|
| Pixel Watch 2 | No minimum build requirement | Not supported |
| Pixel Watch 3 | 25Q2 | Not supported |
| Pixel 6 | No minimum build requirement | 25Q2 |
| Pixel 9 | 25Q2 | Not supported |
| Pixel 10 | 25Q2 | Not supported |
| Galaxy XR (SXR2230P) | No minimum build requirement | Not supported |
Collect Perfetto trace from the command line
This section presents an example workflow for collecting Perfetto traces for use with Wattson. All commands listed in the following steps are meant to be issued from the Android Debug Bridge (adb) host.
Configure and start the trace by creating a Perfetto configuration file on the device. An example configuration can be found at
wattson.cfgin the source tree.The minimum configuration must include the following trace events:
# Polls CPU freq/idle state at the start of trace
data_sources: {
   config {
      name: "linux.sys_stats"
      sys_stats_config {
         # Large period so polling doesn't happen continuously
         # Intent is just to poll once upfront
         cpufreq_period_ms: 100000000
         cpuidle_period_ms: 100000000
      }
   }
}
data_sources: {
   config {
      name: "linux.ftrace"
      ftrace_config {
         ftrace_events: "devfreq/devfreq_frequency"
         ftrace_events: "cpuhp/cpuhp_enter"
         ftrace_events: "cpuhp/cpuhp_exit"
         ftrace_events: "cpuhp/cpuhp_multi_enter"
         ftrace_events: "power/cpu_frequency"
         ftrace_events: "power/cpu_idle"
         ftrace_events: "power/suspend_resume"
      }
   }
}
To enable L3 cache energy usage estimates, enable the
fttrace/printevent:adb shell perfetto --txt -c /data/misc/perfetto-configs/wattson.cfg --background-wait -o /data/misc/perfetto-traces/trace # Optional adb shell simpleperf stat -a -e arm_dsu_0/l3d_cache/,arm_dsu_0/bus_access/ --interval 10(Optional) Set start of Wattson window, a marker embedded in the Perfetto trace that indicates the start of the record. This marker adds additional accuracy of the Wattson measurement.
# Optional
adb shell "echo 'I|0|wattson_start' >/sys/kernel/tracing/trace_marker"
Run the workload of interest.
(Optional) Enable the
ftrace/printtrace event to set the end of the Wattson window:# Optional adb shell "echo 'I|0|wattson_stop' >/sys/kernel/tracing/trace_marker"Flush the trace buffers and pull the Perfetto trace file:
adb shell killall -w perfetto
adb pull /data/misc/perfetto-traces/trace my_perfetto_trace.pb
Collect Perfetto trace using Perfetto UI
To collect traces using the Perfetto UI , you must enable specific settings for Wattson. When recording a new trace in the Perfetto UI, enable the Scheduling details and CPU frequency and idle states toggles:
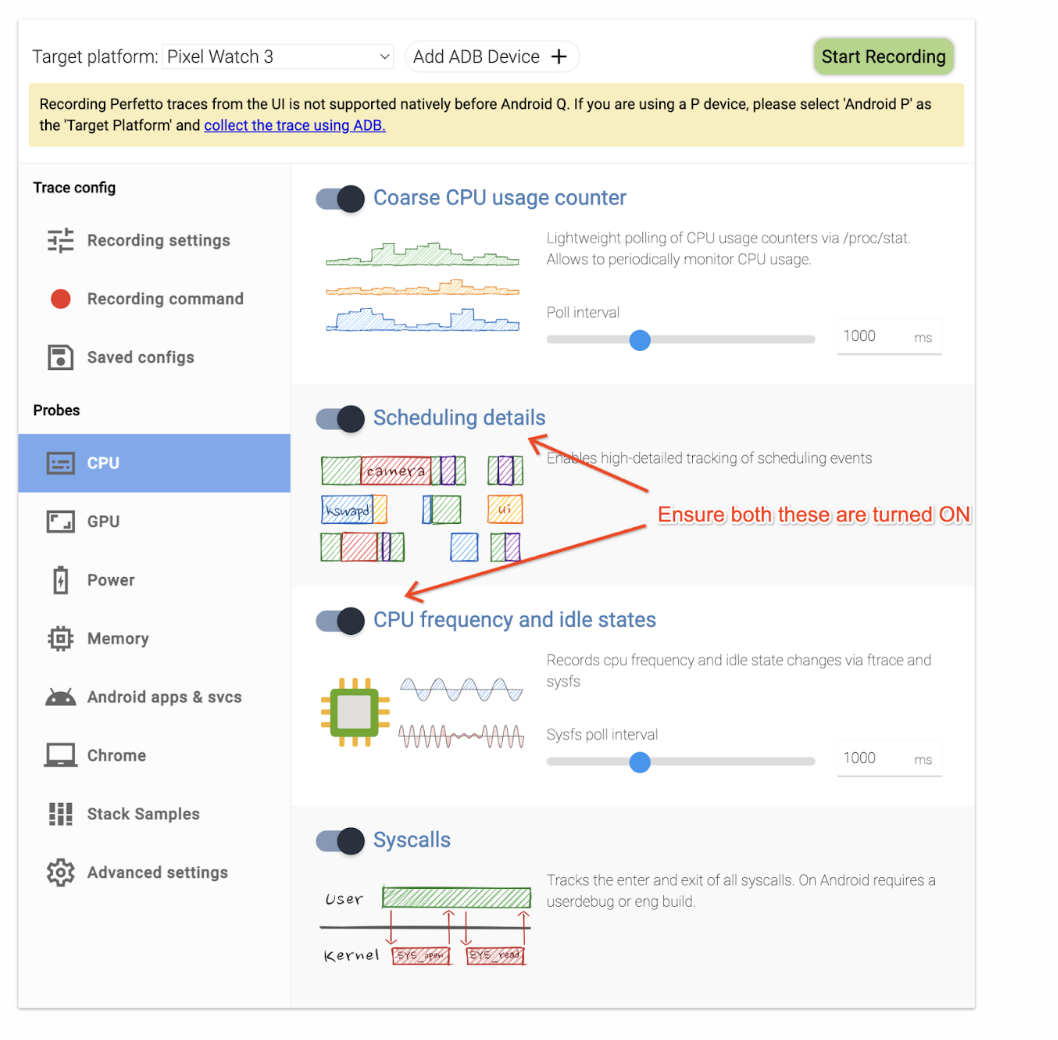
Figure 1. Scheduling details and CPU frequency and idle states toggles.
For Pixel 9 devices, under Ftrace settings, select the devfreq checkbox to enable device frequency collection:
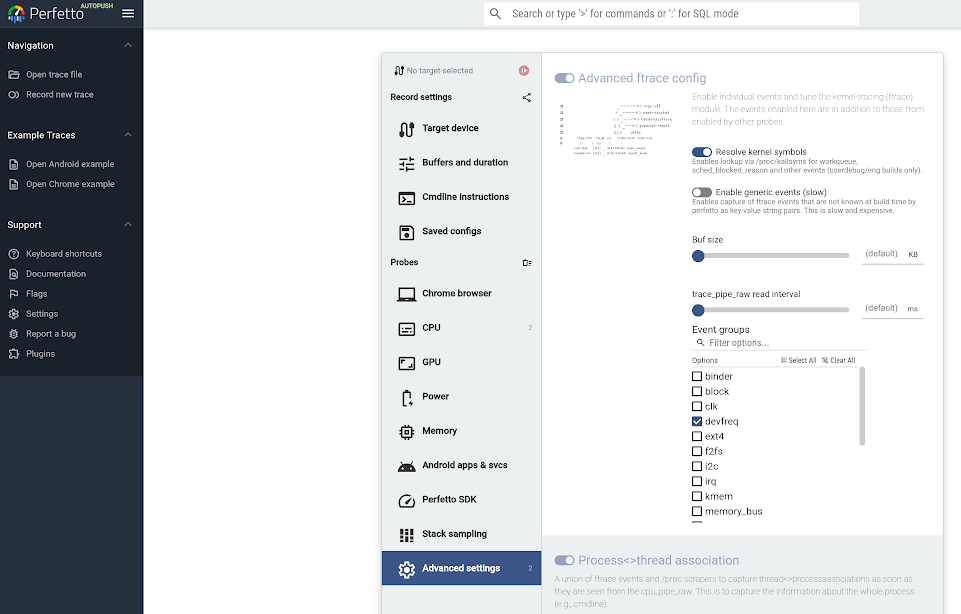
Figure 2. Enable device frequency.
View per rail break down
With Perfetto, analyze Wattson power estimates by selecting a time range to view per-rail statistics, or enable specific trace configurations to attribute power consumption at the thread, process, or package level.
To interact with Wattson in Perfetto:
Open a trace in Perfetto.
If your device is supported by Wattson, the Wattson traces are automatically listed:
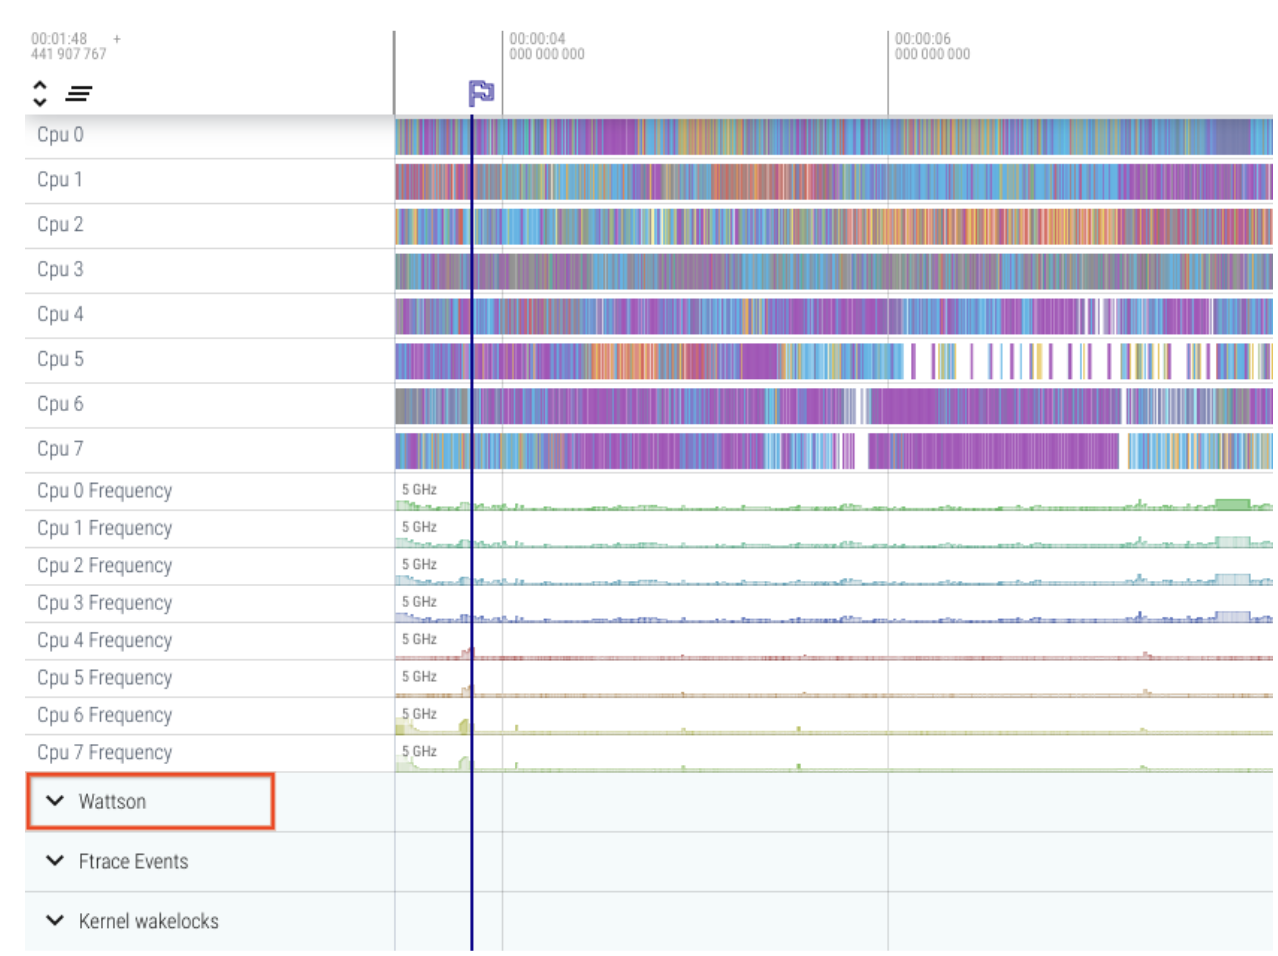
Figure 3. View Wattson traces in Perfetto.
Click Wattson to expand and view per virtual rail breakdown:
All rail graphs are automatically scaled to the same value to show proportion between rails.
Statistics are generated for any user-selected (or marked) region.
The statistics table can be sorted by clicking any column name.
Estimate totals are displayed directly below the column titles.
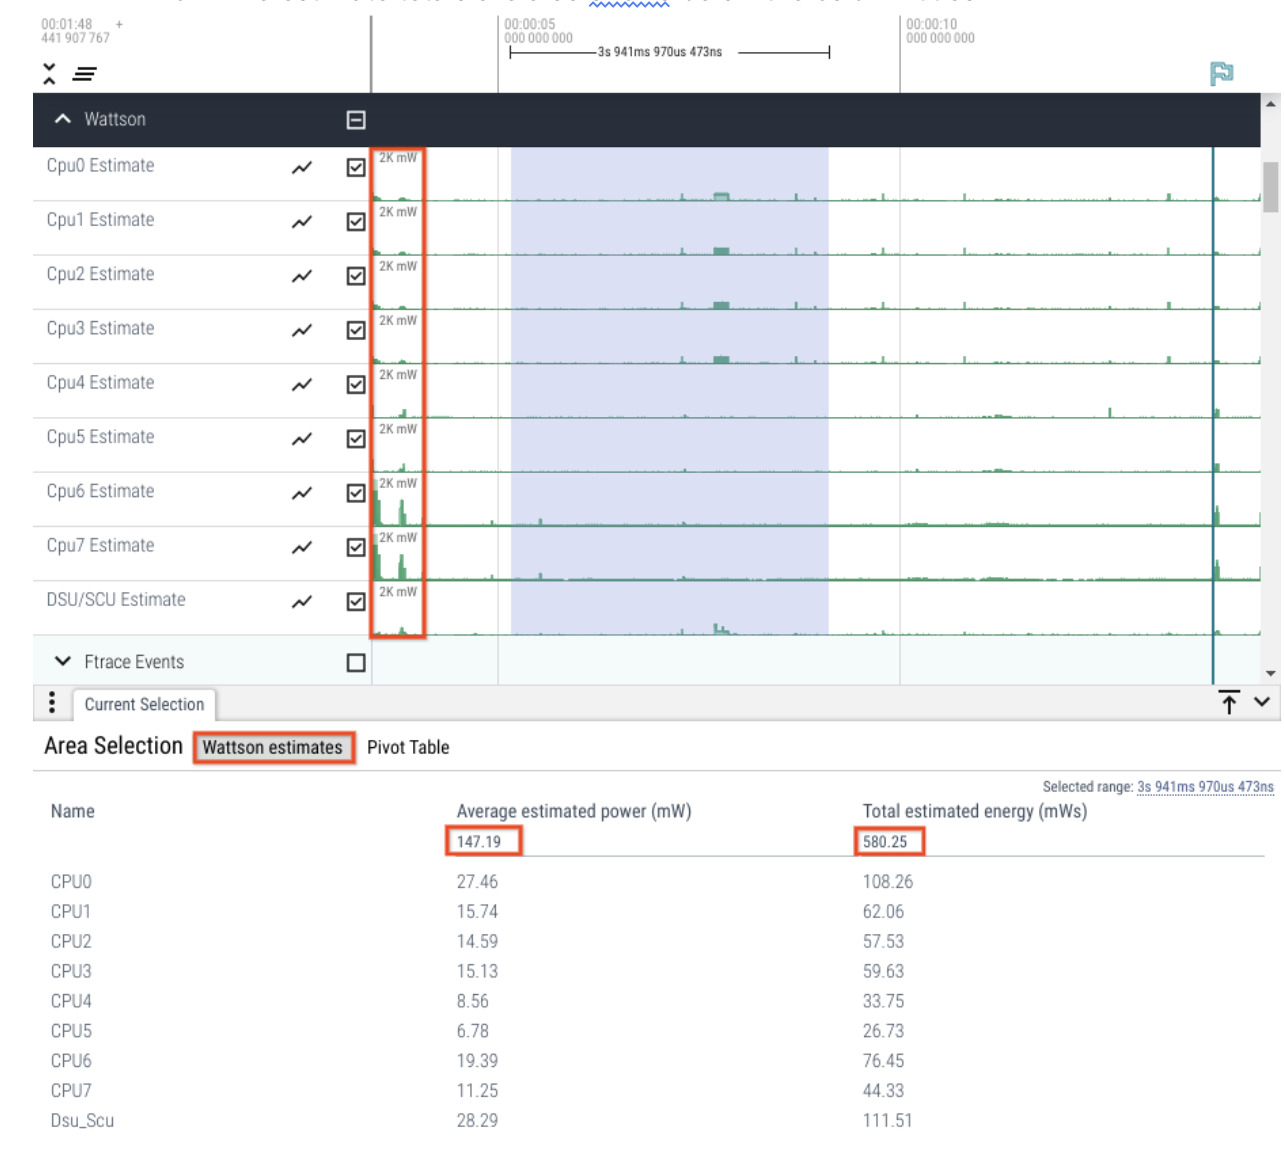
Figure 4. Rail estimates.
View trace per thread, process, or package attributions
If you have scheduler traces enabled and can see thread slices in Perfetto, you can also get thread-level or process-level power or energy attribution:
- In Perfetto, select a region of thread slices.
- View the breakdown for the thread, process, or package.
As with per-rail track statistics, you can click any of the column names to sort by that column.
Analyze thread-level breakdown
In addition to the minimum requirements
for basic power estimation, you need to add the following configuration to
the linux.ftrace section in the wattson.cfg for per thread
level power attribution:
data_sources: {
    config {
        name: "linux.ftrace"
        ftrace_config {
            ftrace_events: "sched/sched_switch"
        }
    }
}
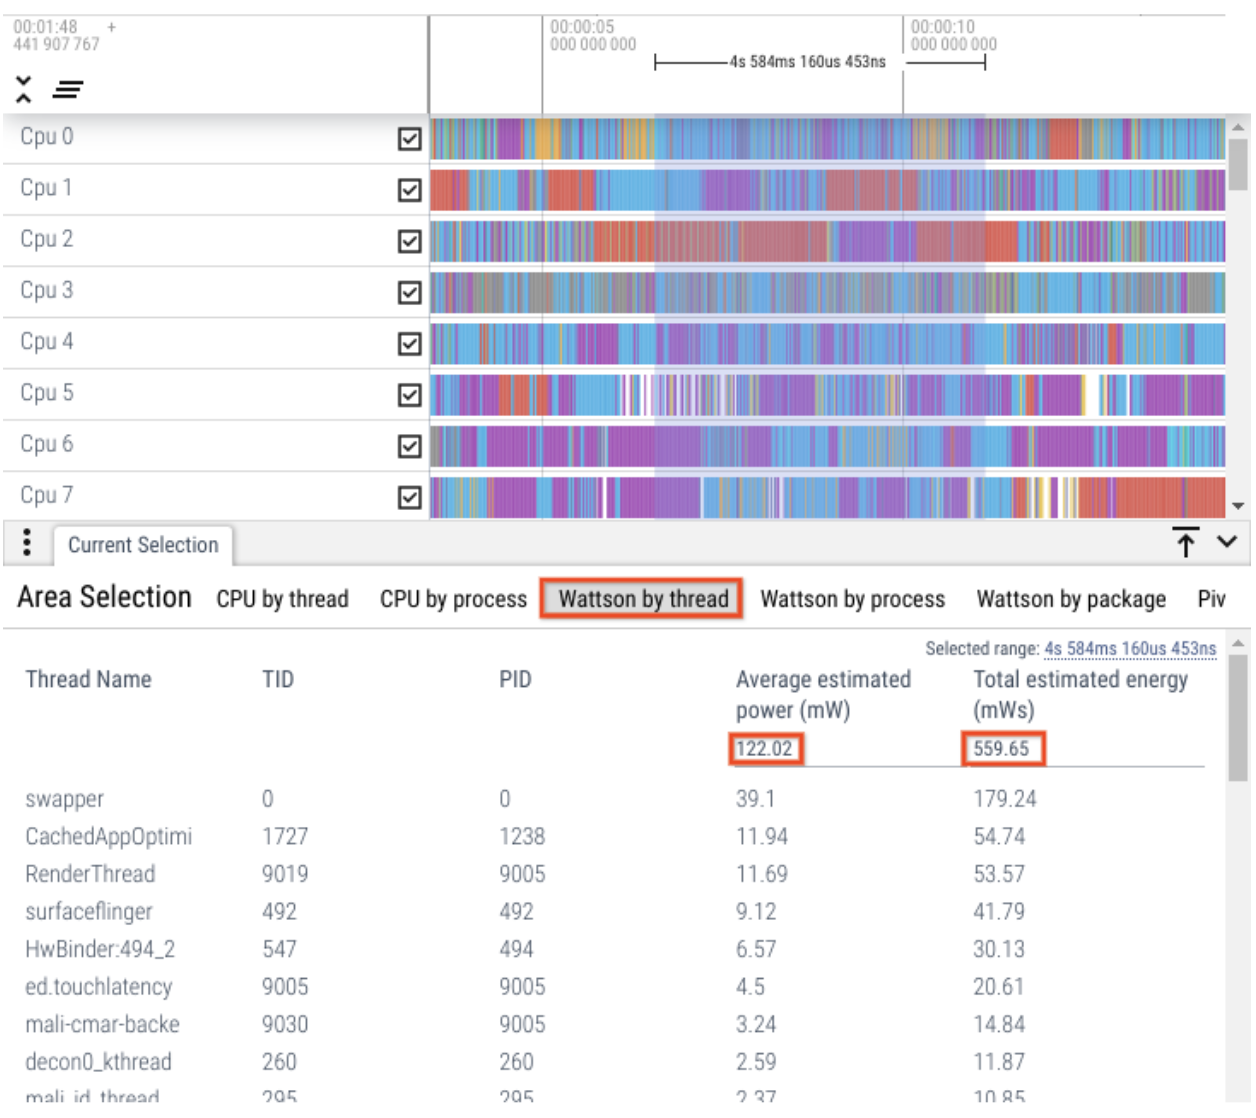
Figure 5. Thread level breakdowns.
Process-level breakdown
Process-level attribution requires process_states to be enabled
on the data collected in the Perfetto trace. Enable the following data source
in your
wattson.cfg configuration file:
data_sources: {
    config {
        name: "linux.process_stats"
        target_buffer: 1
        process_stats_config {
            scan_all_processes_on_start: true
        }
    }
}
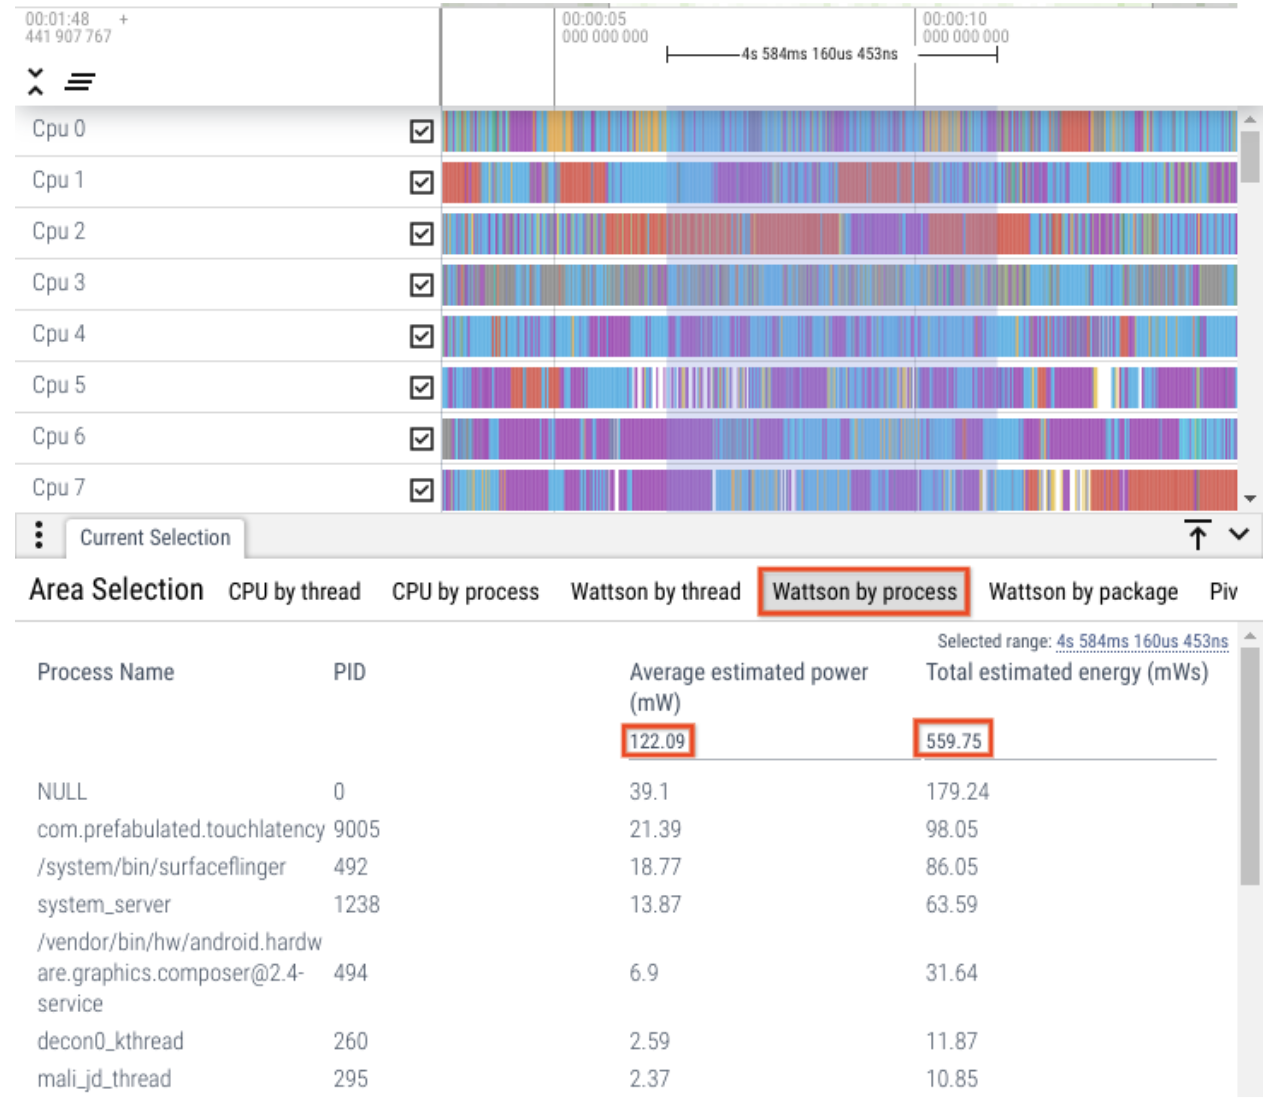
Figure 6. By process breakdown.
Package-level breakdown
Package-level attribution requires android.packages_list enabled on the data
collected in the Perfetto trace. Enable the following data source in your
wattson.cfg configuration file:
data_sources {
  config {
    name: "android.packages_list"
    target_buffer: 1
  }
}
Similar to the thread-level and process-level attribution, when you select a range of thread slices, review package-level breakdown.
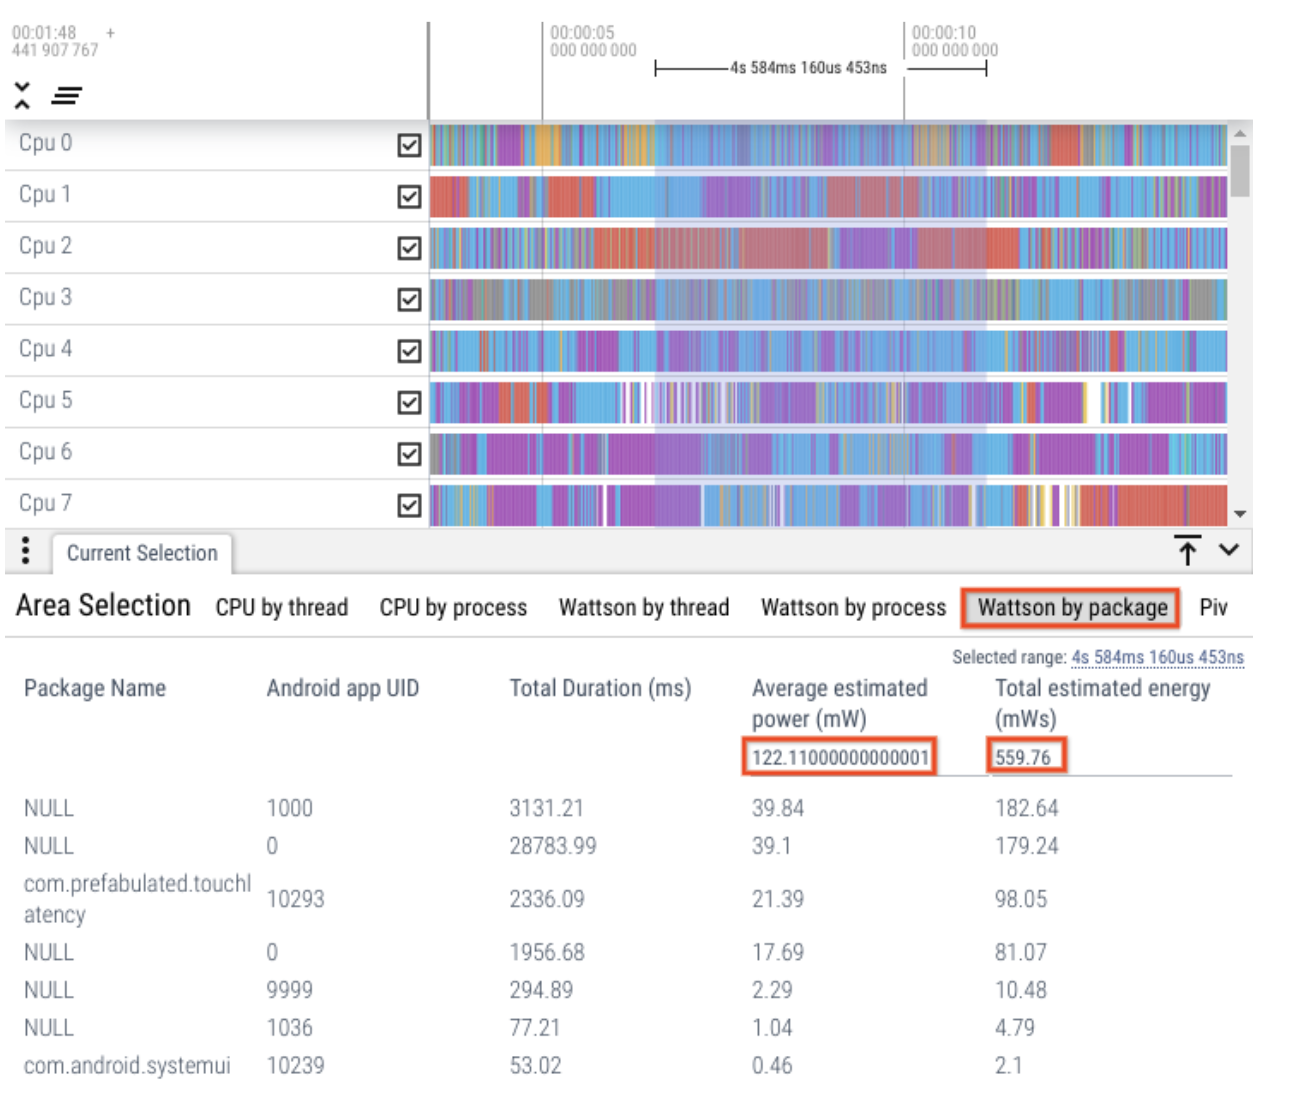
Figure 7. Thread-level breakdown.
GPU power estimation
GPU power estimation is supported on Pixel 6, 6 Pro, and 6a. To enable GPU power
estimation, enable the following data source in your
wattson.cfg configuration file:
data_sources: {
  config {
    name: "linux.ftrace"
    ftrace_config {
      ftrace_events: "mali/gpu_power_state"
      ftrace_events: "power/gpu_frequency"

      # [Optional] Enable GPU Work Period (not used by Wattson, but useful for debugging)
      ftrace_events: "power/gpu_work_period"
    }
  }
}
For a given selection, the Wattson GPU power estimates appear in the Perfetto UI on the Wattson estimates tab.
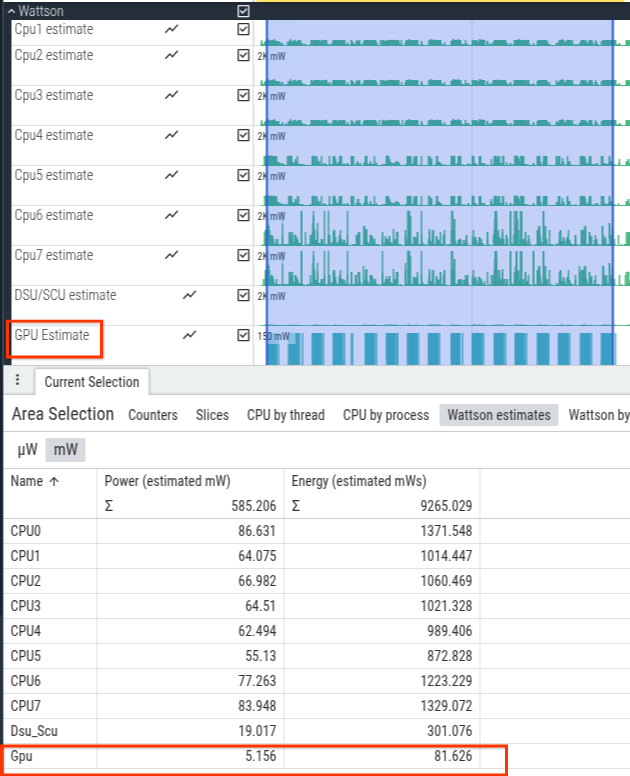
Figure 8. GPU power estimation.
FAQs
Here are some frequently asked questions about Wattson.
Is Wattson expected to match lab power measurement hardware output?
For most workloads, the Wattson estimate matches the lab power hardware measurements. However, this isn't always the case and isn't the intent of Wattson.
Wattson is meant to validate power improvements or catch power regressions without noise from environmental factors (temperature), unit-to-unit variations in chip leakage (the same SoC can have different leakage on a per-unit basis), or calibration differences between lab power measurement hardware.
How is Wattson more useful than looking at CPU time or CPU cycles?
CPU time and cycles don't account for the difference in power or energy consumption between CPU frequencies and CPU types (little versus mid versus big).
A doubled CPU frequency doesn't always result in doubled CPU power or doubled performance.
Is Wattson accurate when compared to hardware solutions?
We have compared Wattson with lab power measurement hardware across multiple use cases provided by multiple teams. The average error in Wattson is 1% points and the standard deviation is 1.5% points. This level of correlation is maintained across tests that are 10 seconds to tests that run for 4 hours. So there's no error creep or error masking that's a factor of time.
Pixel 6 kernel config experiments
Here are some baseline experiments of typical Wattson breakdowns using Pixel 6:
Wattson.cfg
This section provides the typical configuration for Wattson enablement on Perfetto:
  write_into_file: true
  flush_period_ms: 30000
  file_write_period_ms: 30000

  buffers: {
      size_kb: 2048
      fill_policy: RING_BUFFER
  }
  buffers: {
      size_kb: 200000
      fill_policy: RING_BUFFER
  }

  # Needed for process level power attribution
  data_sources: {
      config {
          name: "linux.process_stats"
          target_buffer: 0
          process_stats_config {
              scan_all_processes_on_start: true
          }
      }
  }

  # Needed for package level power attribution
  data_sources: {
      config {
          name: "android.packages_list"
          target_buffer: 0
      }
  }

  # Needed for determining CPU freq/idle initial state
  data_sources: {
      config {
          name: "linux.sys_stats"
          sys_stats_config {
              cpufreq_period_ms: 100000000
              cpuidle_period_ms: 100000000
          }
      }
  }

  # Needed for estimating power and thread level power attribution
  data_sources: {
      config {
          name: "linux.ftrace"
          target_buffer: 1
          ftrace_config {
              # Minimum data sources for estimating power
              ftrace_events: "power/cpu_frequency"
              ftrace_events: "power/cpu_idle"
              ftrace_events: "power/suspend_resume"
              ftrace_events: "cpuhp/cpuhp_enter"
              ftrace_events: "cpuhp/cpuhp_exit"
              ftrace_events: "cpuhp/cpuhp_multi_enter"
              ftrace_events: "devfreq/devfreq_frequency"

              # Needed for Wattson start/stop markers
              ftrace_events: "ftrace/print"

              # Needed for thread level power attribution
              ftrace_events: "sched/sched_switch"

              # Needed for process level power attribution
              ftrace_events: "sched/sched_process_free"
              ftrace_events: "task/task_newtask"
              ftrace_events: "task/task_rename"
          }
      }
  }