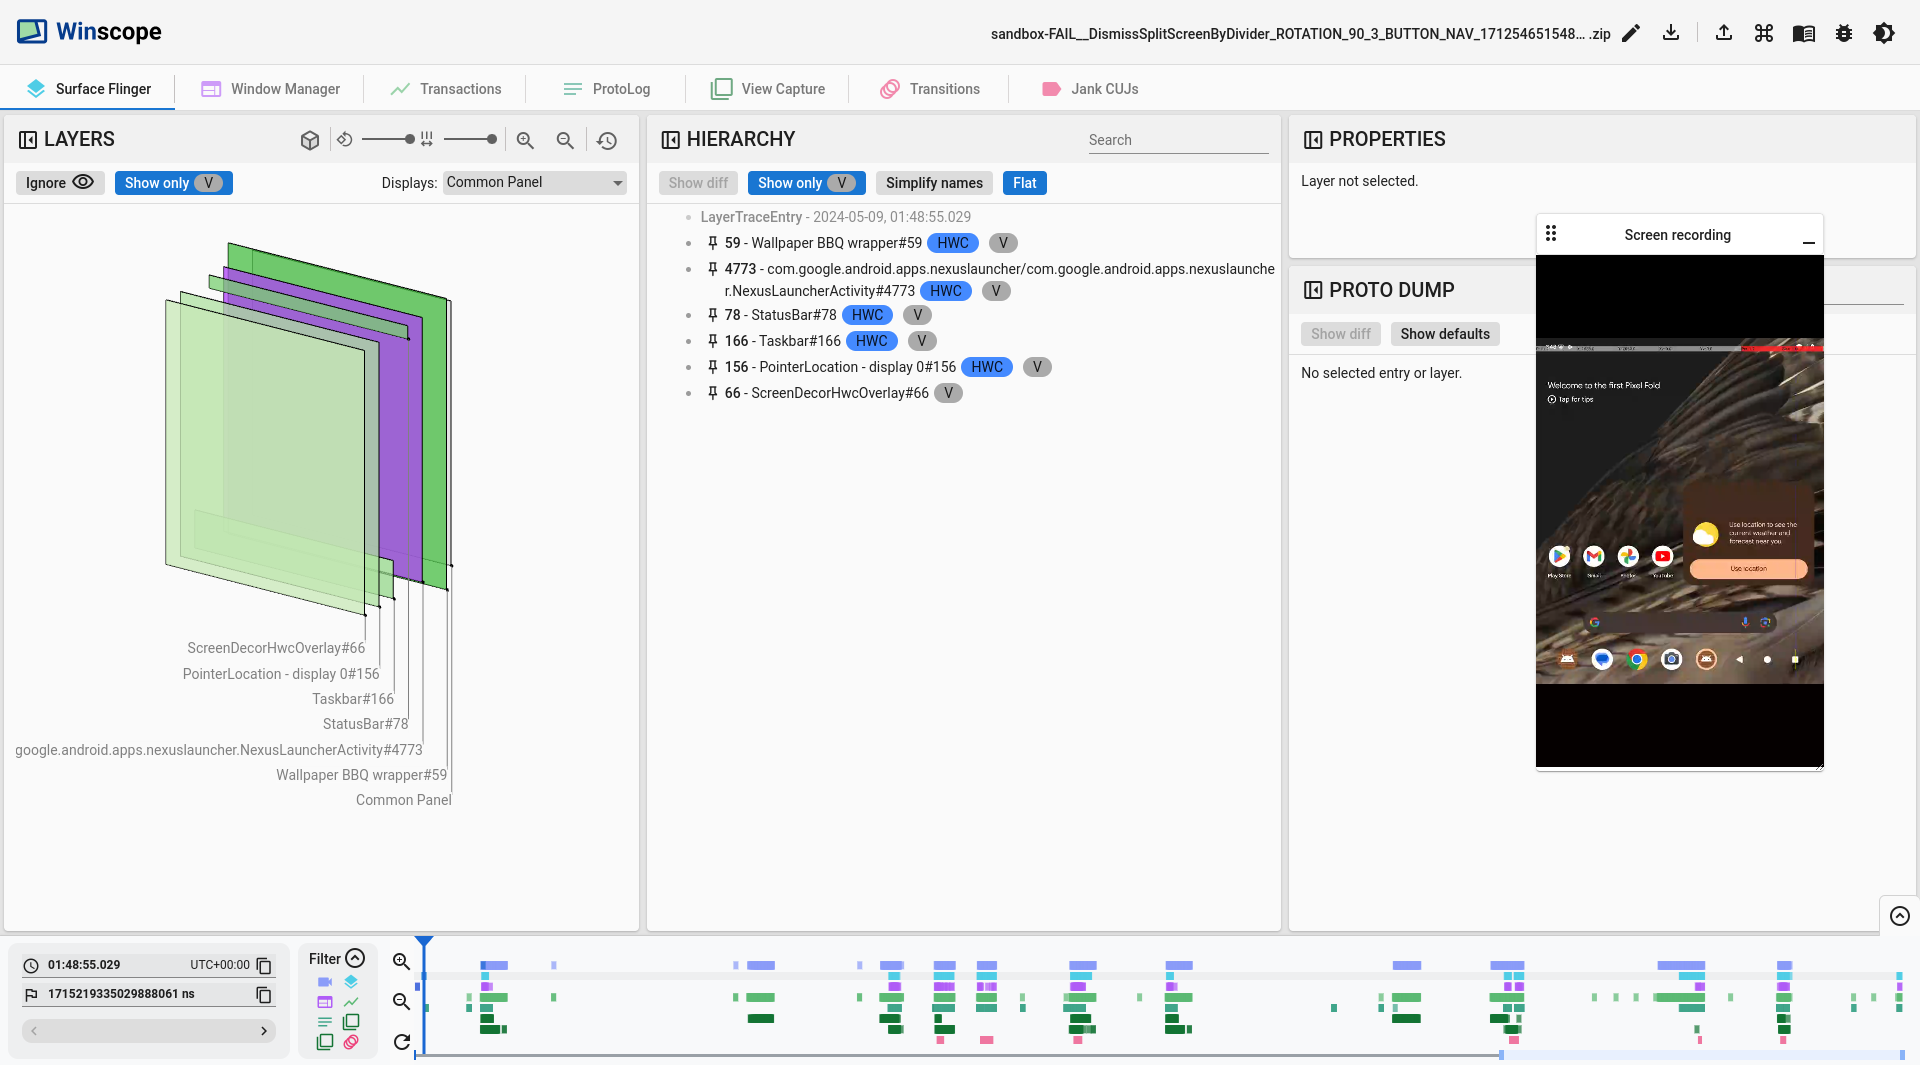
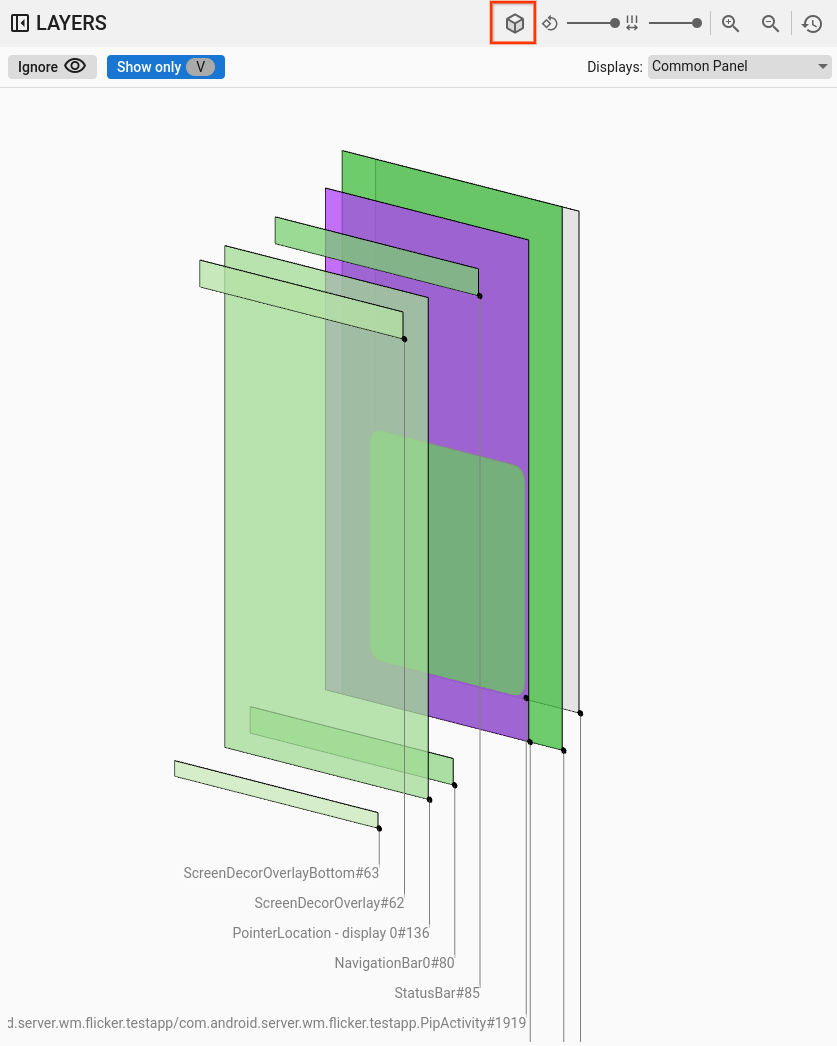
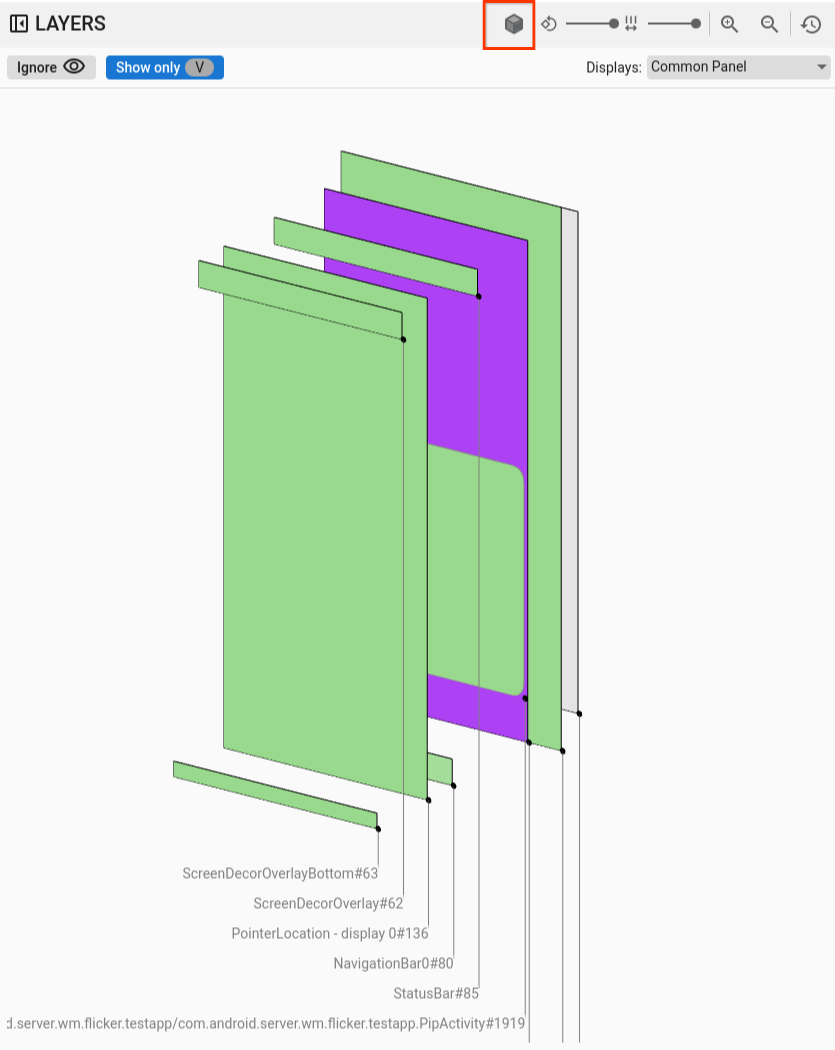
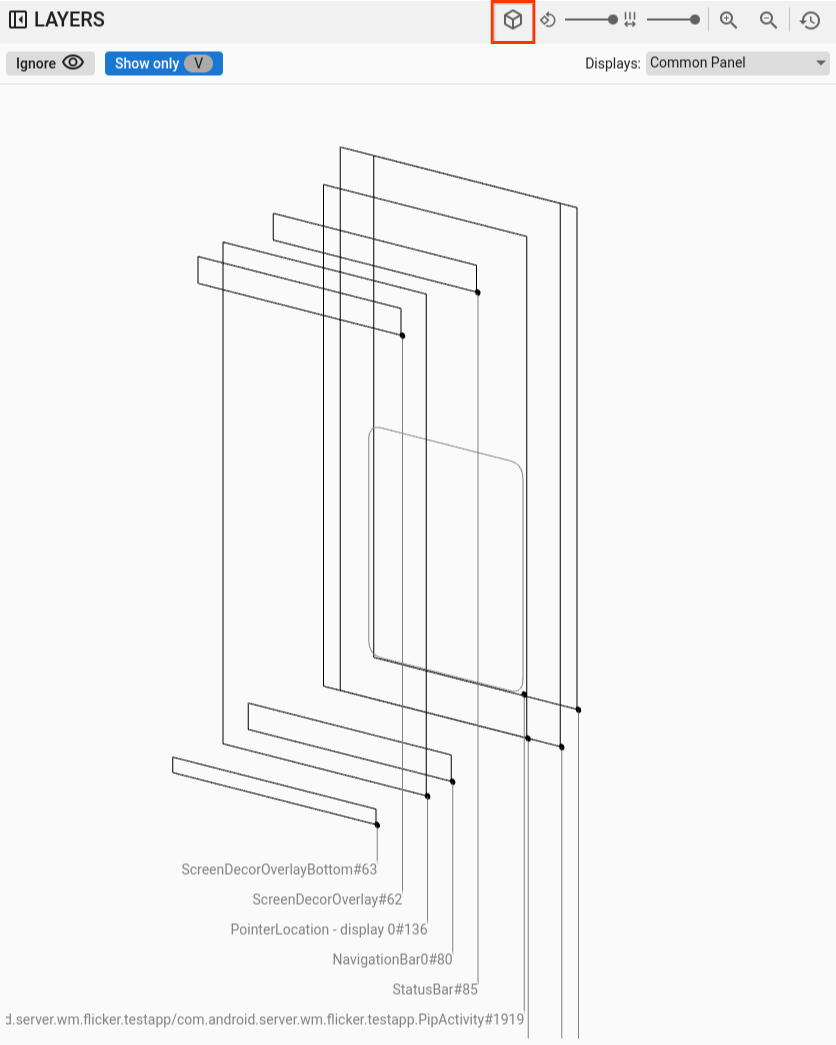
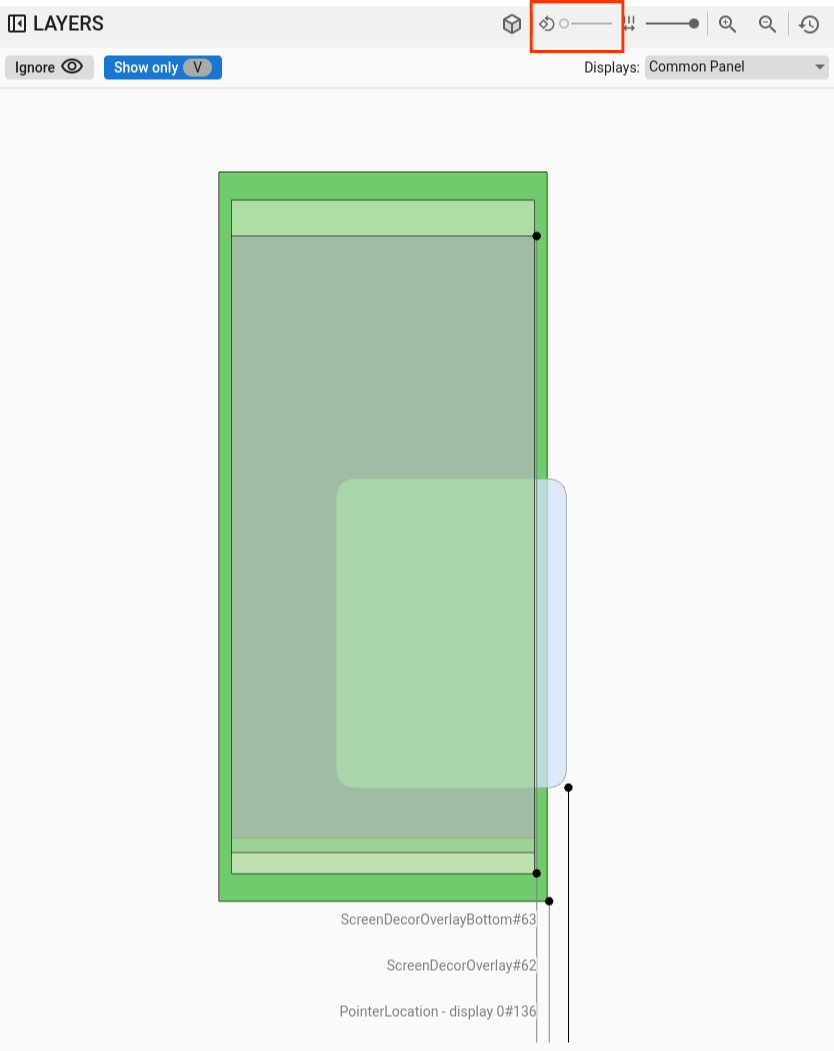
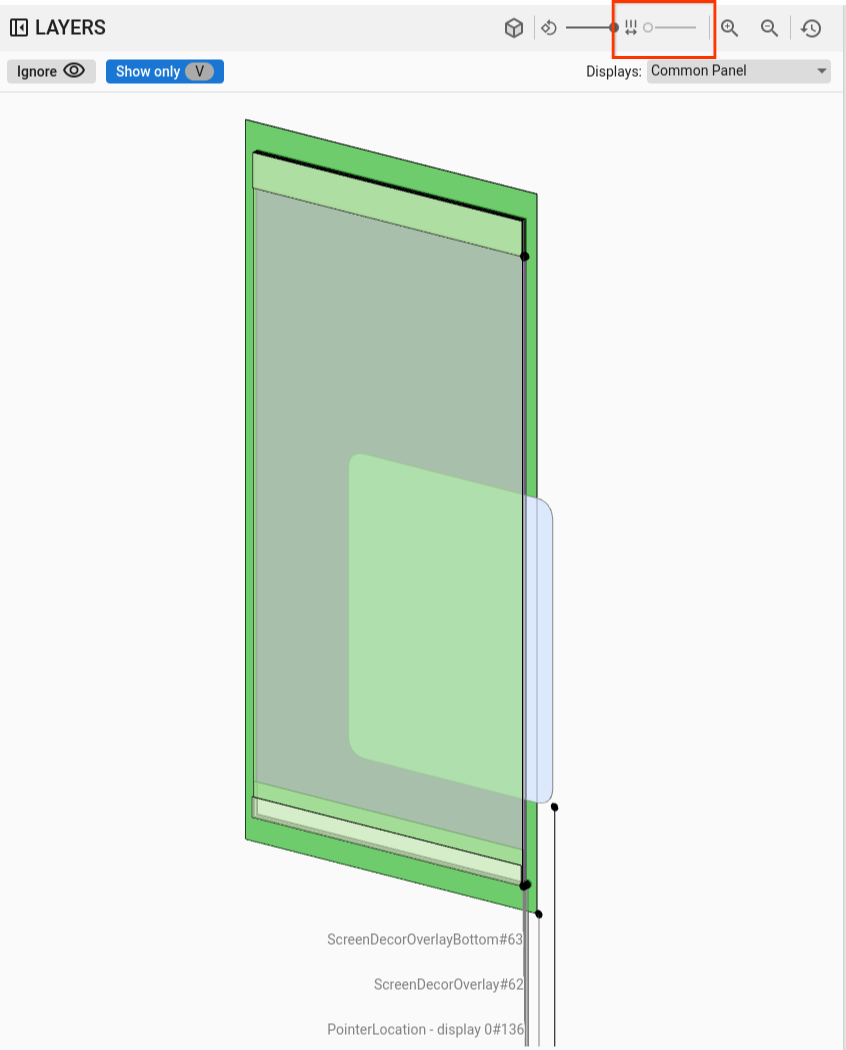
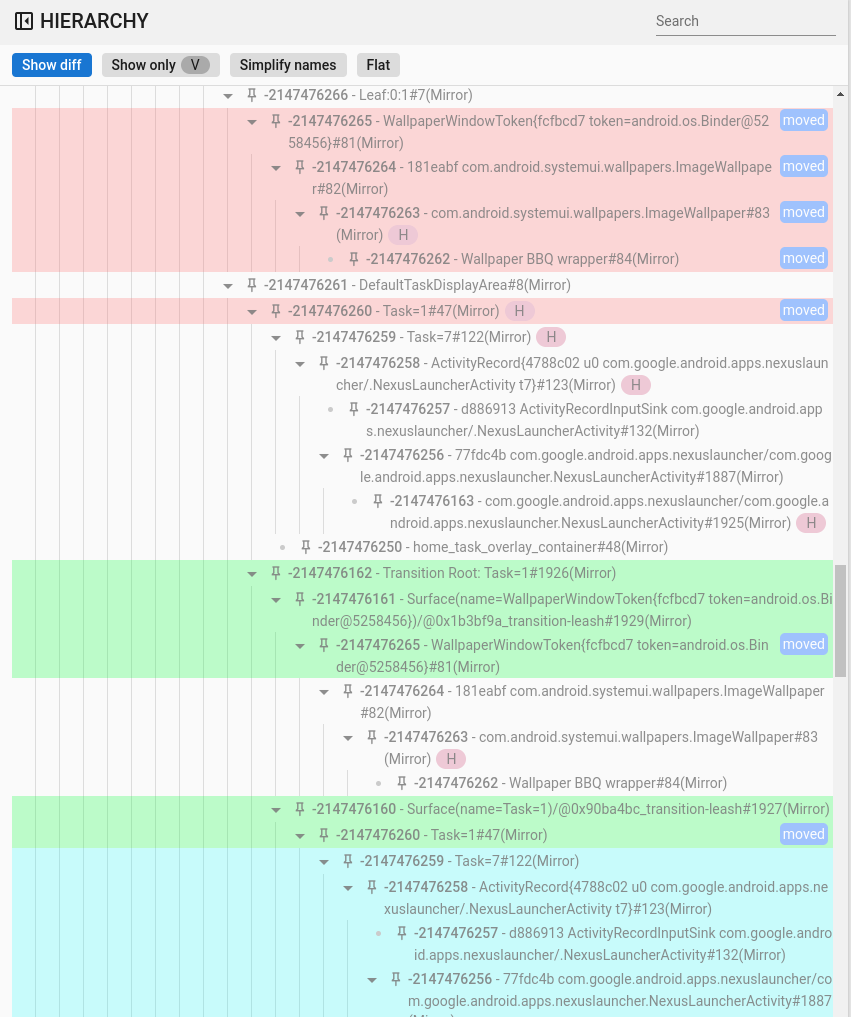
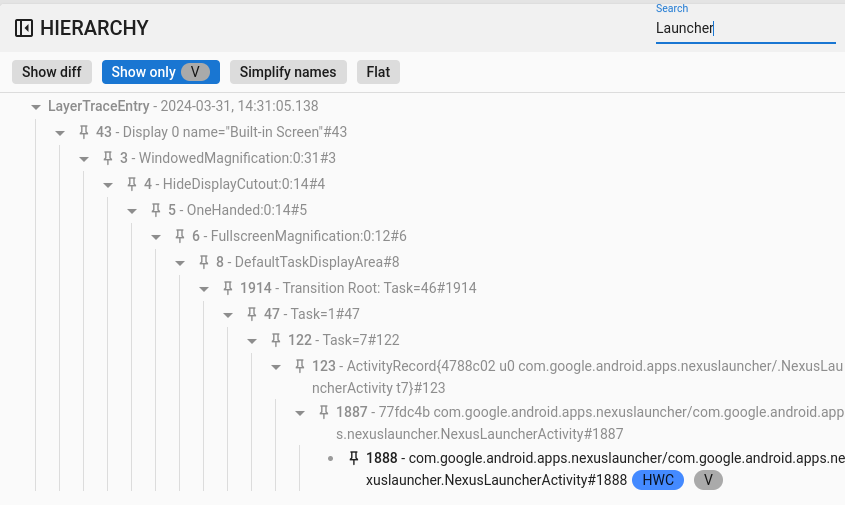
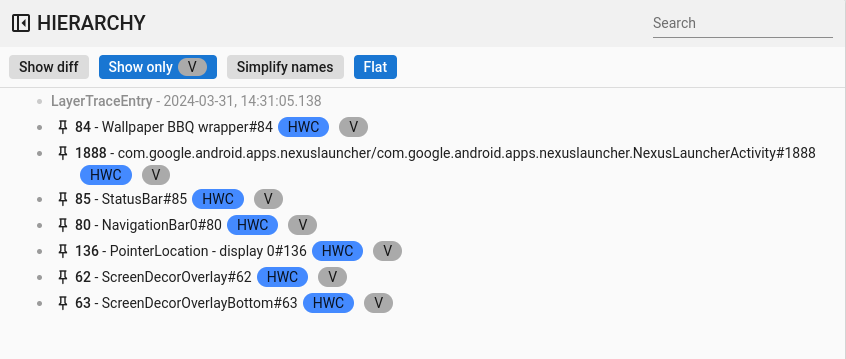
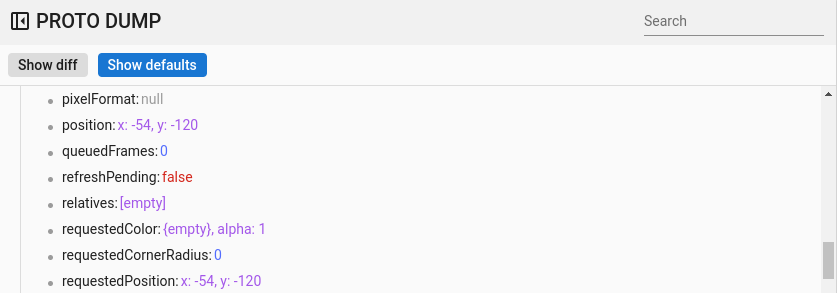
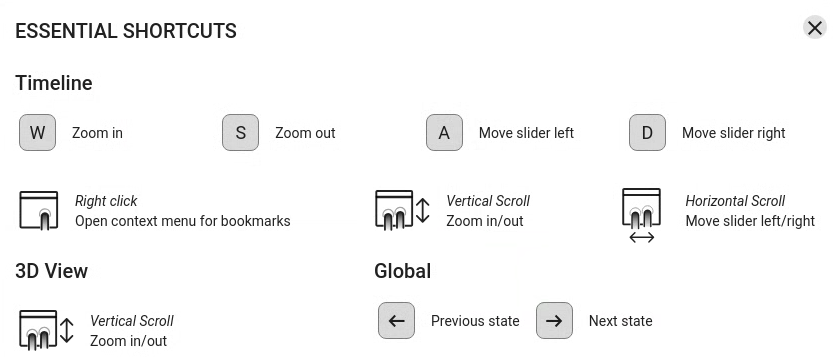
[[["容易理解","easyToUnderstand","thumb-up"],["確實解決了我的問題","solvedMyProblem","thumb-up"],["其他","otherUp","thumb-up"]],[["缺少我需要的資訊","missingTheInformationINeed","thumb-down"],["過於複雜/步驟過多","tooComplicatedTooManySteps","thumb-down"],["過時","outOfDate","thumb-down"],["翻譯問題","translationIssue","thumb-down"],["示例/程式碼問題","samplesCodeIssue","thumb-down"],["其他","otherDown","thumb-down"]],["上次更新時間:2025-07-27 (世界標準時間)。"],[],[],null,["# Analyze traces\n\nWhen you've [loaded traces](/docs/core/graphics/winscope/load),\nclick **View traces** to visualize the uploaded traces. Tabs for each trace\nappear on the top panel of the window. If the uploaded file contains the\nrelevant traces, a floating view of the screen recording trace or screenshot is\noverlaid on the screen:\n\n**Figure 1.** View traces on Winscope.\n\nThe following sections describe the UI elements on the **View traces**\nscreen.\n\nRectangles\n----------\n\nA **LAYERS** panel for Winscope views, such as WindowManager, SurfaceFlinger,\nand ViewCapture, includes rectangular elements from\nthe trace that visually represent their position and order on the z-axis.\n\nThrough the navigation controls on the **LAYERS** panel, you can modify the\nmode in which the rectangular layers are drawn, along with their spacing and\nrotation:\n\n**Figure 2.** Rectangle controls.\n\n### Gradient format\n\n| **Note:** Winscope uses the gradient format by default.\n\nTo inspect all elements in the hierarchy more effectively, you can use the\n**rect format** button to switch the rectangle drawing format to *Gradient* .\nIn the *gradient* format, the **rect format** button turns light gray.\n\nIn this mode, the opacity of each rectangle is reduced based on its z-ordering,\nwith rectangles with higher z-orders being more translucent. This lets you see\nall the elements in the hierarchy without having to worry about rectangles\nobscuring each other:\n\n**Figure 3.** Rectangle gradient.\n\n### Opacity format\n\nTo change the rectangle drawing format to *opacity* , click the **rect format**\nbutton. In the *opacity* format, the **rect format** button turns dark gray.\n\nIn this mode, each rectangle is drawn based on its opacity, such as surface or\nview opacity:\n\n**Figure 4.** Rectangle opacity.\n\n### Wireframe format\n\nTo change the rectangle representation to *wireframe* , click the\n**rect format** button. This representation makes it simpler to examine and\nanalyze individual elements within the hierarchy. In the *wireframe* _ format,\nthe **rect format** button turns into an outline with no shading:\n\n**Figure 5.** Rectangle wireframe.\n\n### Rotation\n\nUse the **rotation slider** to change the perspective of the rectangles between\n0 and 45 degrees, letting you spot scenarios where elements go off screen:\n\n**Figure 6.** Rectangle rotation.\n\n### Spacing\n\nUse the **spacing slider** to control the spacing between layers, creating a\nflattened or more spread view for better inspecting elements z-ordering:\n\n**Figure 7.** Rectangle facing.\n\n### Display and window selection\n\nIn the SurfaceFlinger view, when recording data on devices with multiple\ndisplays, a menu shows the available displays so that the you can select\nonly the displays of interest.\n\nIn ViewCapture, when recording multiple system windows, such as notification\nshade, task bar, and launcher, the menu lists available windows.\n\n### Pan and zoom\n\nYou can adjust the position of the rectangles either horizontally or vertically\nby clicking their area and dragging the mouse. For zooming in, zooming out,\nor resetting the zoom level, you can use either the scroll wheel or the zoom\nbuttons on the control bar.\n\nHierarchy\n---------\n\nWinscope viewers often incorporate a hierarchy viewer. The viewer in Figure 1\ndepicts various hierarchies based on the trace being analyzed. For example, the\nviewer can display the window hierarchy within WindowManager or the view\nhierarchy within a System UI window.\n\nFor information on specific hierarchy types, see sections on respective traces.\n\nThis section describes the general hierarchy usage, such as the\n[**Show diff**](#analyze-hierarchy-diff),\n[**Show only V**](#analyze-hierarchy-visible),\n[**Flat**](#analyze-hierarchy-flat), and [Search](#analyze-hierarchy-filter)\nfeatures.\n\n**Figure 8.** Hierarchy controls.\n\n### Show diff\n\nWhen the **Show diff** feature is enabled, Winscope automatically monitors and\ndisplays the changes between the current state and the previous state. The\n**Show diff** feature highlights elements that are removed in *red* , elements\nthat are modified in *blue* , and new elements that are created in *green*. This\nvisual representation allows for quicker identification and understanding of the\ndifferences between the two states, making it easier to track changes and\nidentify potential issues.\n| **Note:** Diffs are computed at runtime and this operation adds a delay. When this mode is active, the trace navigation is less responsive.\n\n**Figure 9.** Show diff hierarchy.\n\n### Search and filter\n\nThe hierarchy viewer offers a **search** capability that uses regular\nexpressions (regex). This filter targets both the element's name and\nits value (for properties). When the filter matches a child element in the\nhierarchy, the entire chain of parents up to the tree's root becomes visible, as\nshown in the following figure:\n\n**Figure 10.** Search hierarchy.\n\n### Show only visible\n\nWith the **Show only visible** feature, you can filter out all concealed\nelements within a hierarchy. By default, Winscope shows both visible and\ninvisible elements. Visible elements are drawn in black, while invisible ones\nappear in gray.\n\n### Flat\n\nThe **Flat** button reorganizes the hierarchical structure by eliminating the\nparent-child relationships among elements. This action renders all elements on\nthe same level. When combined with the **Show only visible** option, the\nresulting hierarchy displays only the visible elements, excluding their parent\nelements, as shown in the following figure:\n\n**Figure 11.** Flat hierarchy.\n\nProperties\n----------\n\nWithin Winscope, many viewers integrate a properties viewer. This viewer\npresents various lists of properties associated with an element selected from\nthe hierarchy view. For example, the viewer can show the properties of an\nactivity within WindowManager or those of a view in System UI.\n\nFor information on specific properties, see sections on\n[SurfaceFlinger](/docs/core/graphics/winscope/analyze/sf),\n[WindowManager](/docs/core/graphics/winscope/analyze/wm), and\n[View Capture](/docs/core/graphics/winscope/analyze/view-capture) traces.\n\nThis section describes the general hierarchy in the\n*Show diff* , *Search* , and *Show defaults* features.\n\n### Show diff\n\nUsage of the **Show diff** feature is the same as [Show diff in the hierarchy view](#analyze-hierarchy-diff).\n\n### Search and filter\n\nUsage of the **Search** feature is the same as [Search in the hierarchy view](#analyze-hierarchy-filter).\n\n### Show defaults\n\nBy default, Winscope displays only modified property values, which are\nnondefault values for their respective data types. For example, Winscope omits\n`false` for booleans, `0` for integers, `null` for objects, and `[]` for arrays.\nThis streamlining simplifies the list of properties visible to the user.\nHowever, it's beneficial in certain situations to have a comprehensive view\nof all element-related information. In such cases, the **Show defaults** option\nreveals all available properties in Winscope, including those\nwith empty or null values.\n\n**Figure 12.** Properties defaults.\n\nGeneral shortcuts\n-----------------\n\nWinscope supports the following shortcuts:\n\n**Figure 13.** General shortcuts."]]