自 2025 年 3 月 27 日起,我們建議您使用 android-latest-release
而非 aosp-main
建構及貢獻 AOSP。詳情請參閱「Android 開放原始碼計畫變更」。
分析波形
透過集合功能整理內容
你可以依據偏好儲存及分類內容。
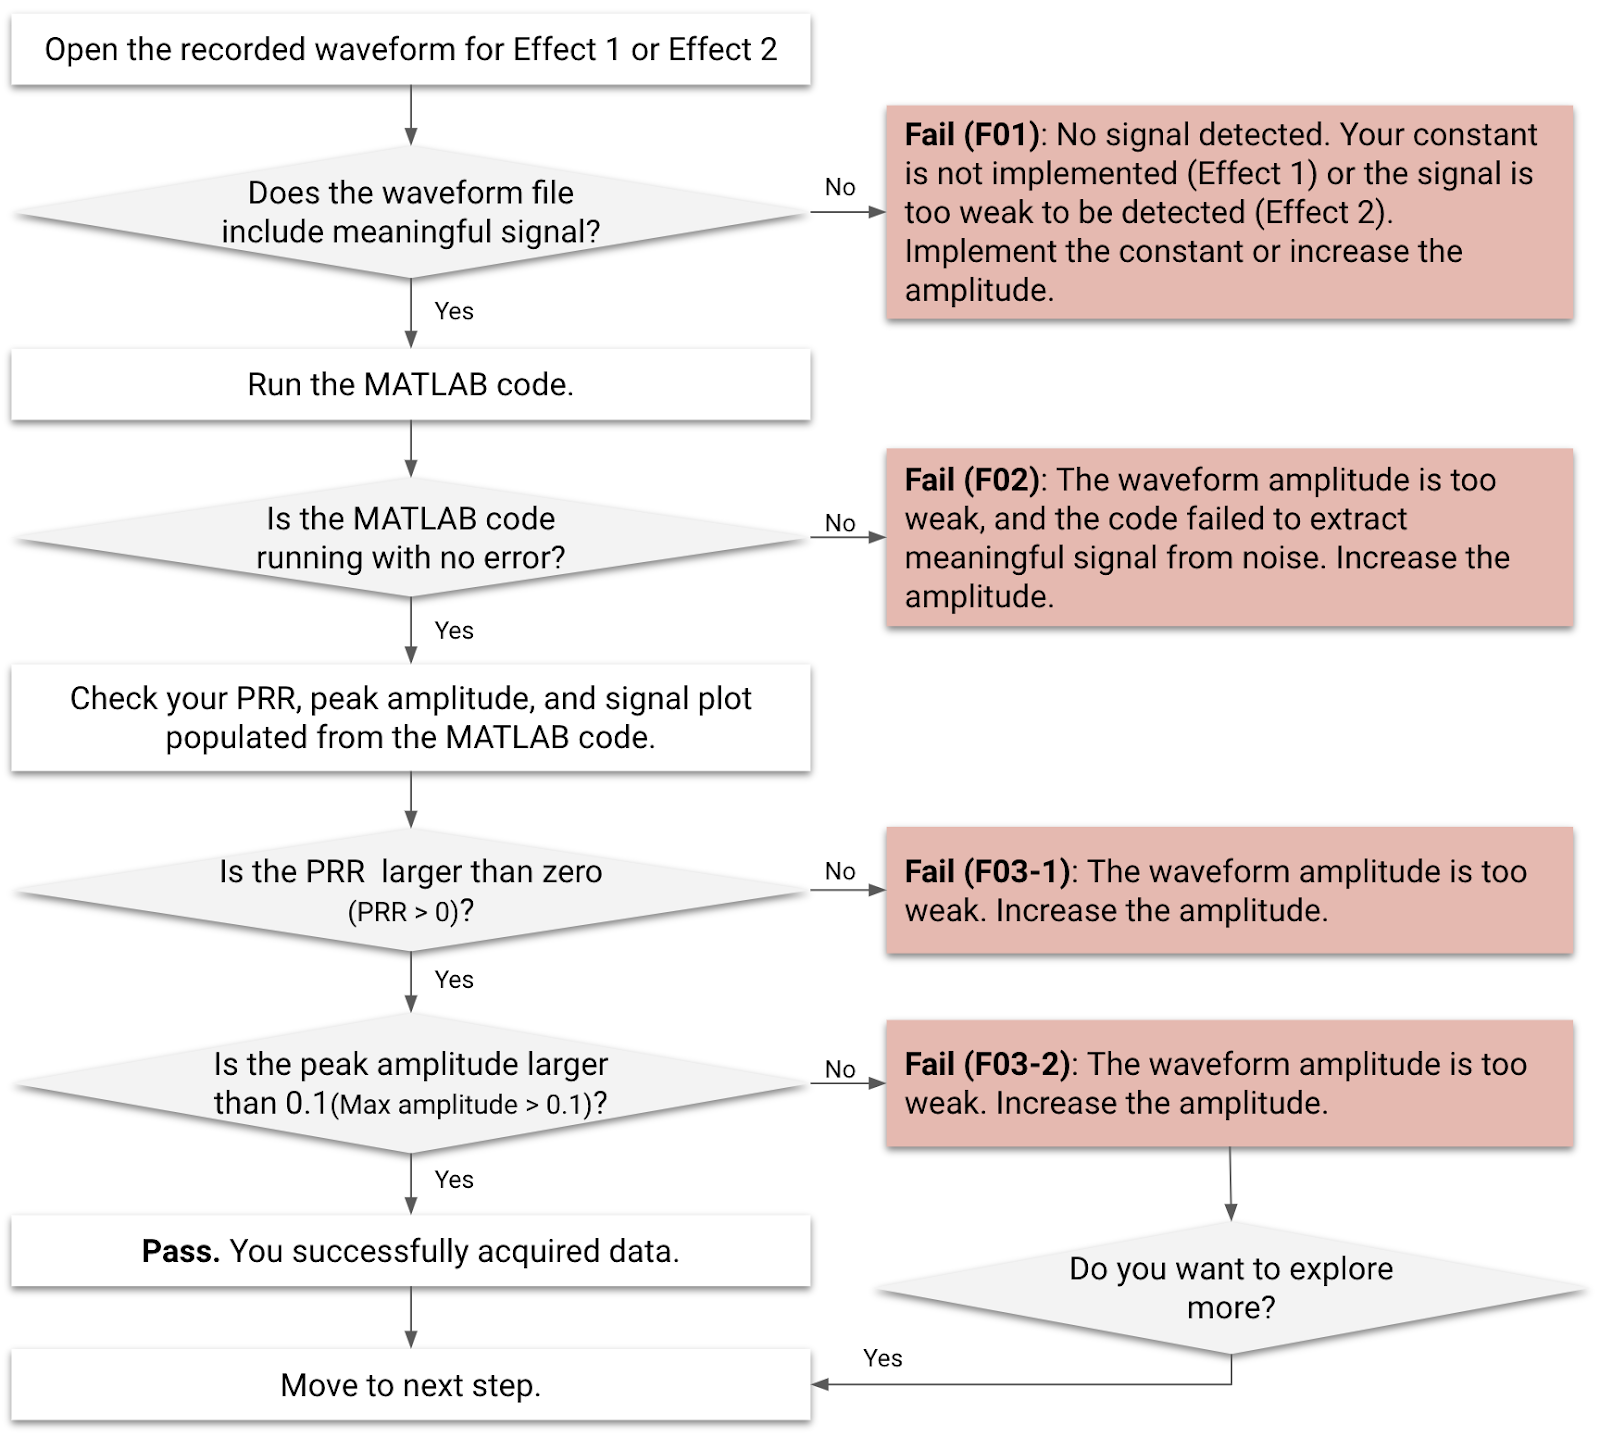
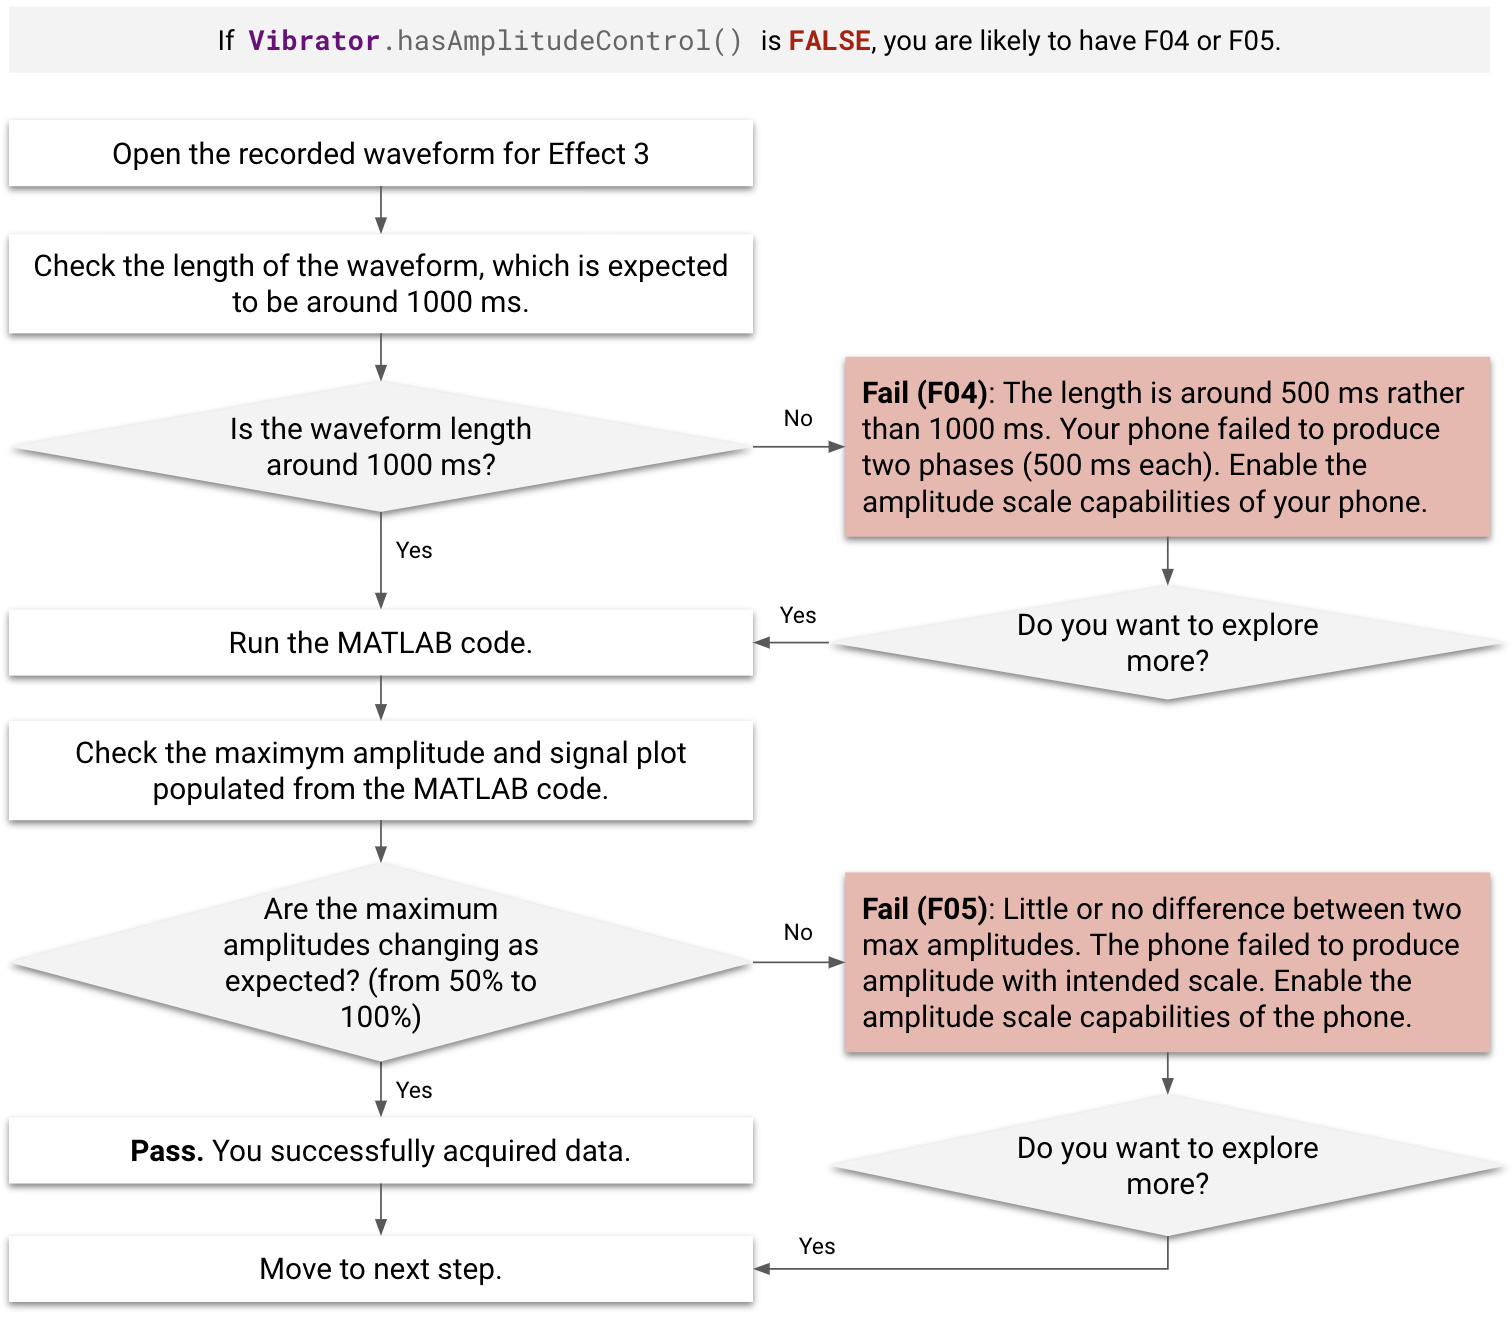
下載並執行 MATLAB 檔案後,請使用下列流程圖分析先前步驟中記錄的波形檔案。
圖 1. 效果 1 和效果 2 的波形分析流程圖
圖 2. 效果 3 的波形分析流程圖
失敗案例
在分析前和分析期間,請檢查失敗案例 (F01–F05)。
- MATLAB 程式碼無法處理以 F01 和 F02 指定的效果。
- 即使效果已指定為 F03-1,也無法加入效能地圖,即使這些效果已透過 MATLAB 程式碼處理,且沒有任何錯誤。
- 即使處理失敗,仍可將指定為 F03-2、F04 和 F05 的效果加入效能地圖。
- 如果
Vibrator.hasAmplitudeControl()
傳回 false
,則 DUT 會指定為 F04 或 F05。
- 如果在測試期間按下效果 3 按鈕後,出現明顯延遲 (超過 500 毫秒),測試裝置就會獲得 F04 的評分。
失敗代碼 |
失敗說明 |
適用的特效 |
失敗原因 |
修正失敗問題 |
F01 |
未記錄任何輸出信號。 |
效果 1 |
未實作觸覺回饋常數。 |
按照「
實作常數」一節的說明,實作空常數。 |
F02 |
MATLAB 程式碼錯誤。MATLAB 錯誤的範例如下:
索引超出矩陣維度。 |
效果 1、效果 2 |
觸覺效果的振幅太弱。 |
增加觸覺效果的振幅。 |
F03-1、F03-2 |
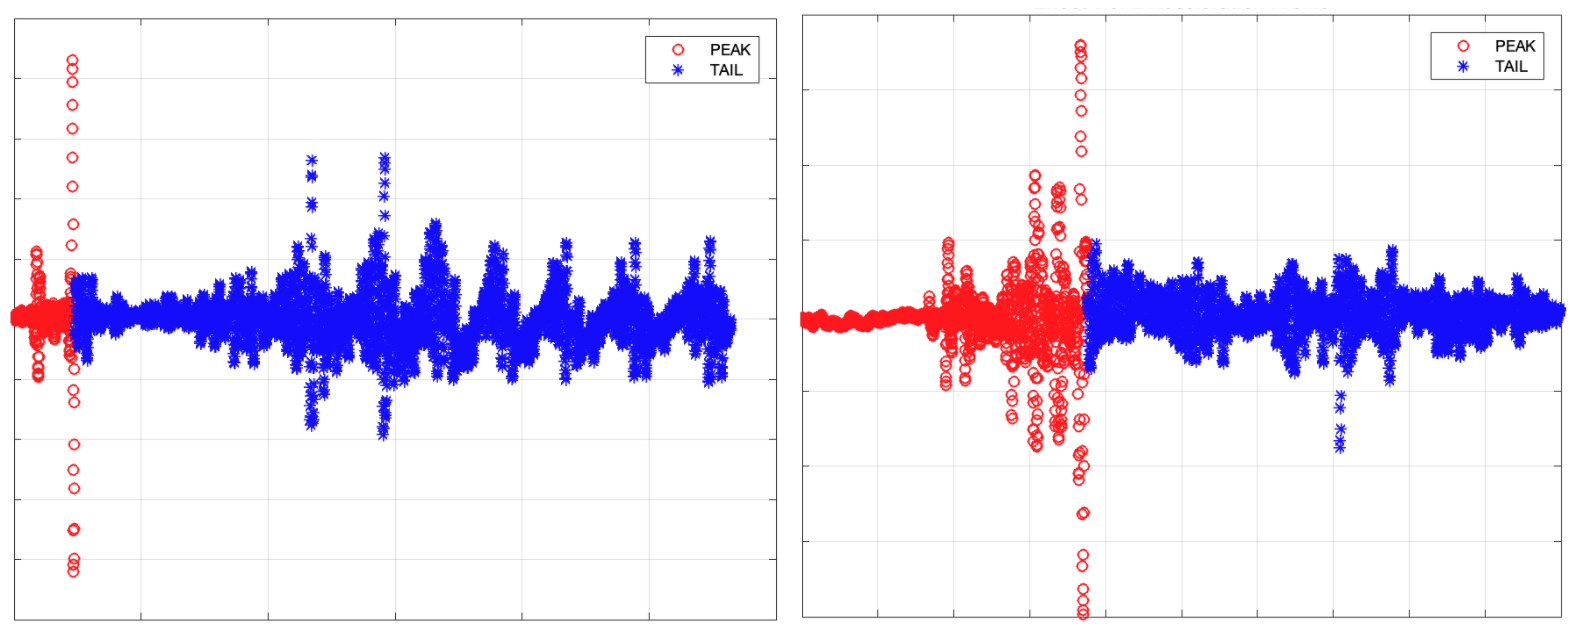
[F03-1] 沒有 MATLAB 錯誤,但從 MATLAB 程式碼填入的 PRR 小於 0。
[F03-2] 沒有 MATLAB 錯誤,但透過 MATLAB 程式碼填入的振幅小於 0.1 g。 |
效果 1、效果 2 |
觸覺效果的振幅太弱。 |
增加觸覺效果的振幅。 |
F04 |
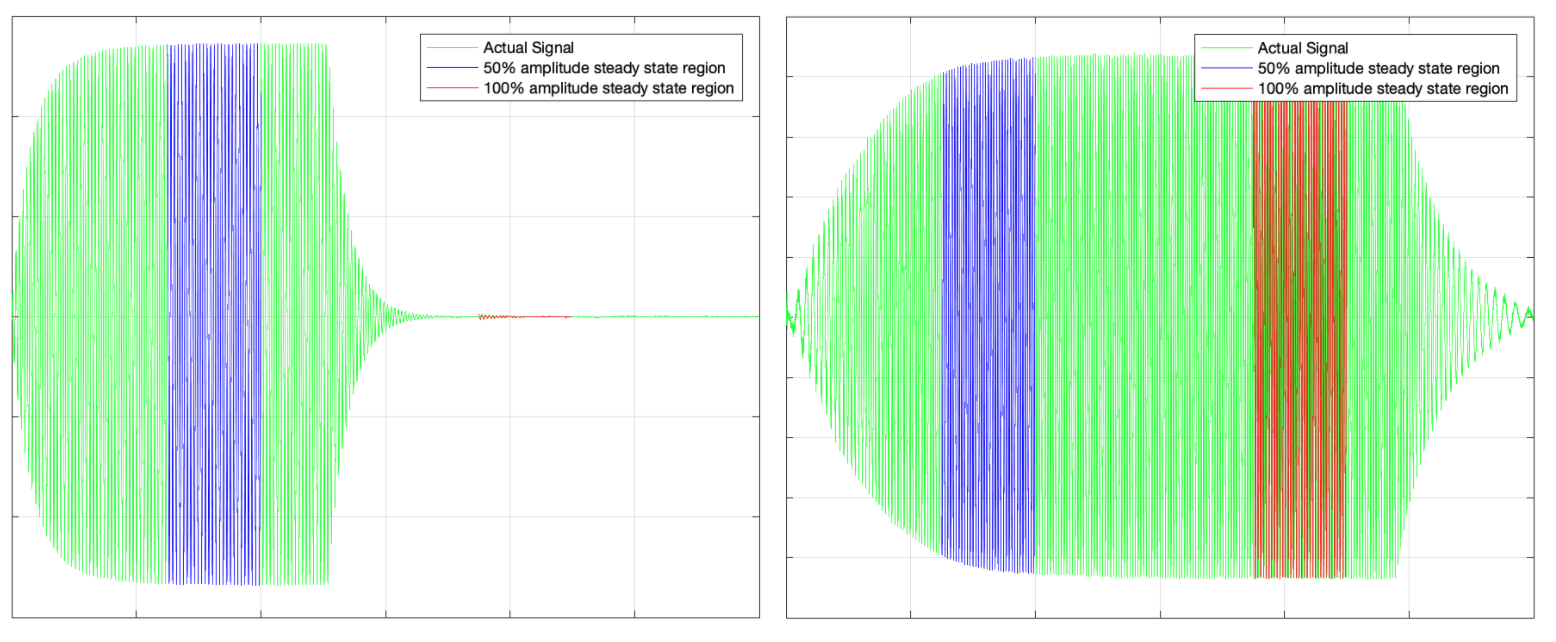
信號太短 (約 500 毫秒,而非 1000 毫秒)。 |
效果 3 |
裝置無法正確產生經過調整的振幅。即使呼叫 50% 振幅,系統仍會以 0% 振幅產生前 500 毫秒的週期振幅。 |
啟用振幅縮放功能。 |
F05 |
兩個最大振幅值的差異很小或沒有差異。 |
效果 3 |
裝置無法正確產生經過調整的振幅。 |
啟用振幅縮放功能。 |
圖 3. F03-1 (左) 和 F03-2 (右) 的 MATLAB 信號圖範例
圖 4. MATLAB 信號圖表範例 (左側為 F04,右側為 F05)
從分析中取得資料
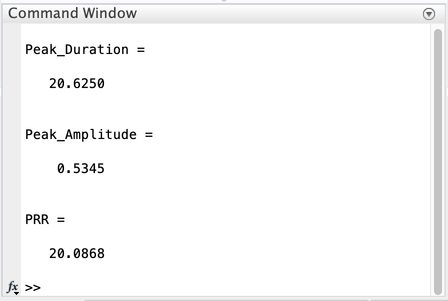
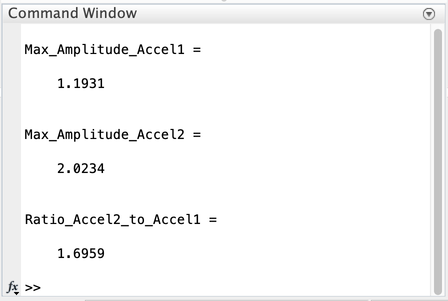
為每個效果執行 MATLAB 程式碼時,您可以讀取 MATLAB 軟體指令視窗中顯示的結果。
圖 5. 指令視窗中的 MATLAB 結果範例,效果 1 (第一個) 和效果 3 (第二個)
效果 1 和效果 2 (短暫脈衝)
- 峰值時間長度 (毫秒)
- 最大振幅 (g)
- 使用 PRR 計算清晰度指標的圖表 (FOMS = PRR/峰值時間長度)
效果 3 (長震動)
使用效能地圖比較結果會納入從 Android 生態系統中代表性裝置取得的相同資料集,以便您據此填入效能地圖。這有助於您瞭解整個生態系統,並將資料與成效地圖資料進行比較。
請參閱下表,瞭解 DUT 與 Android 生態系統中的其他手機或平板電腦相比的差異。以此概念為架構的具體問題如下:與其他具有類似特徵 (例如價格等級) 的 Android 手機相比,我的手機效能是優於其他手機,還是遜於其他手機?
[輸入]
要分析的效果 |
[輸出]
峰值/最大振幅 (G) |
[輸出] 尖峰時間長度 (毫秒) |
[輸出]
脈衝至環狀比率 (PRR) |
效果 1:預先定義的觸覺常數 (VibrationEffect.EFFECT_CLICK ) |
[1] 資料 1-1 |
[2] 資料 1-2 |
[3] 資料 1-3 |
效果 2:短暫的自訂觸覺技術效果 (時間長度 = 20 毫秒,振幅 = 100%) |
[4] Data 2-1 |
[5] 資料 2-2 |
[6] 資料 2-3 |
效果 3-1:長時間自訂觸覺技術效果的加速度第 1 階段,前 500 毫秒的振幅為 50% |
[7] Data 3-1 |
不適用 |
不適用 |
特效 3-2:長時間自訂觸覺技術效果加速階段 2,在第 500 毫秒時以 100% 振幅播放 |
[8] 資料 3-2 |
不適用 |
不適用 |
效果 1 和效果 2 的脈衝至鈴聲比率和峰值振幅
在效果 1 和效果 2 中測量的兩個重要參數是「脈衝與環形比率」(PRR)和「峰值振幅」。這些參數是根據加速計設定所做的加速度測量值。
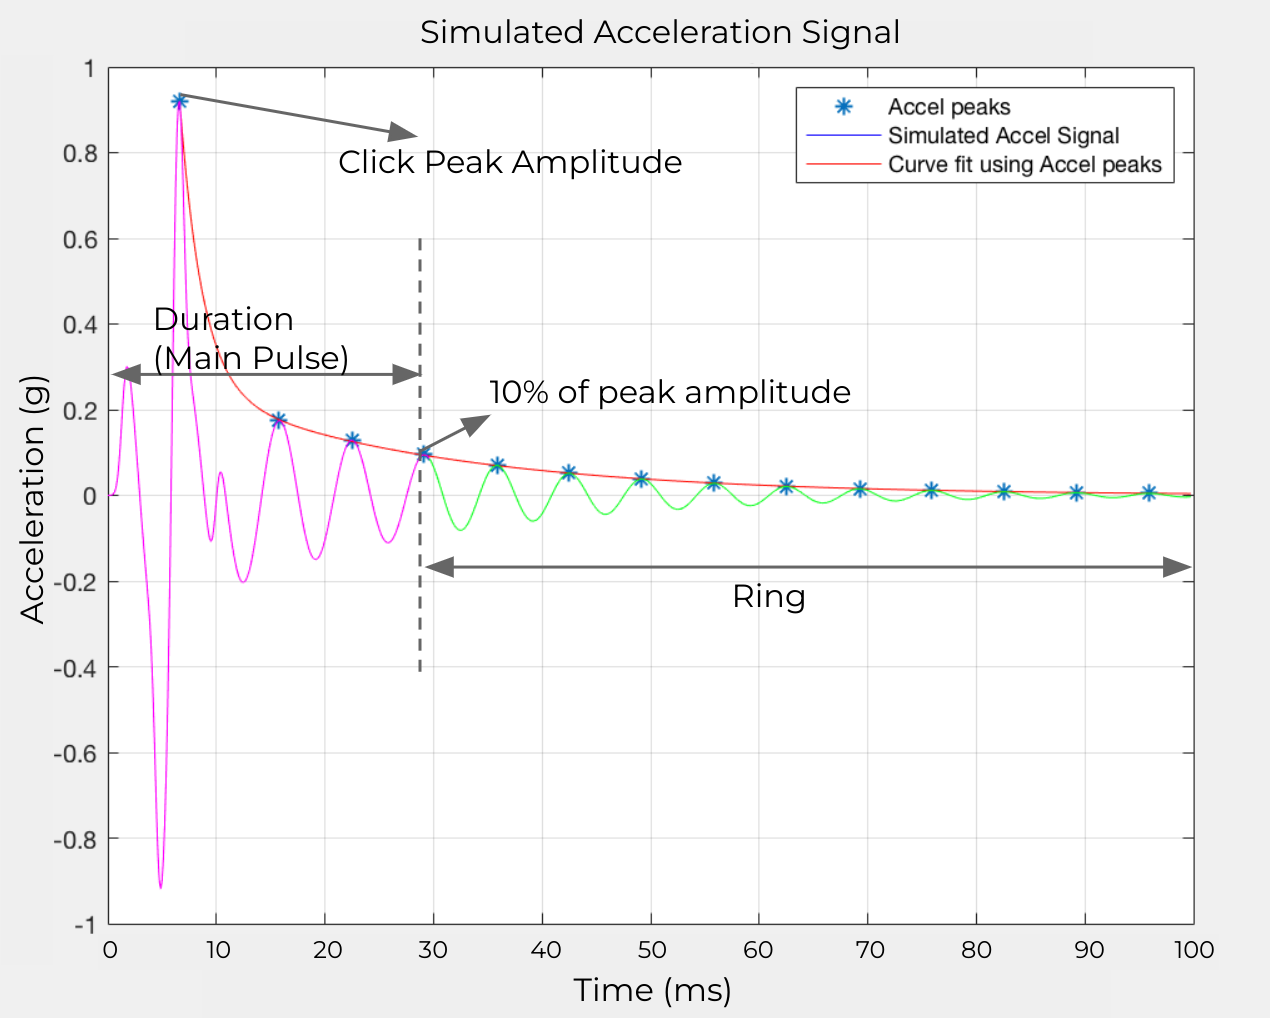
計算 PRR 時,主脈衝與振鈴振幅的比率。Duration 是主脈衝的經過時間。PRR 的公式如下:
$$
\text{Pulse to ring ratio (PRR)} = 20log_{10}\frac{\text{RMS (main pulse)}}{\text{RMS (ring)}}
$$
圖 6. 模擬加速度信號
這些元素如圖 6 所示:
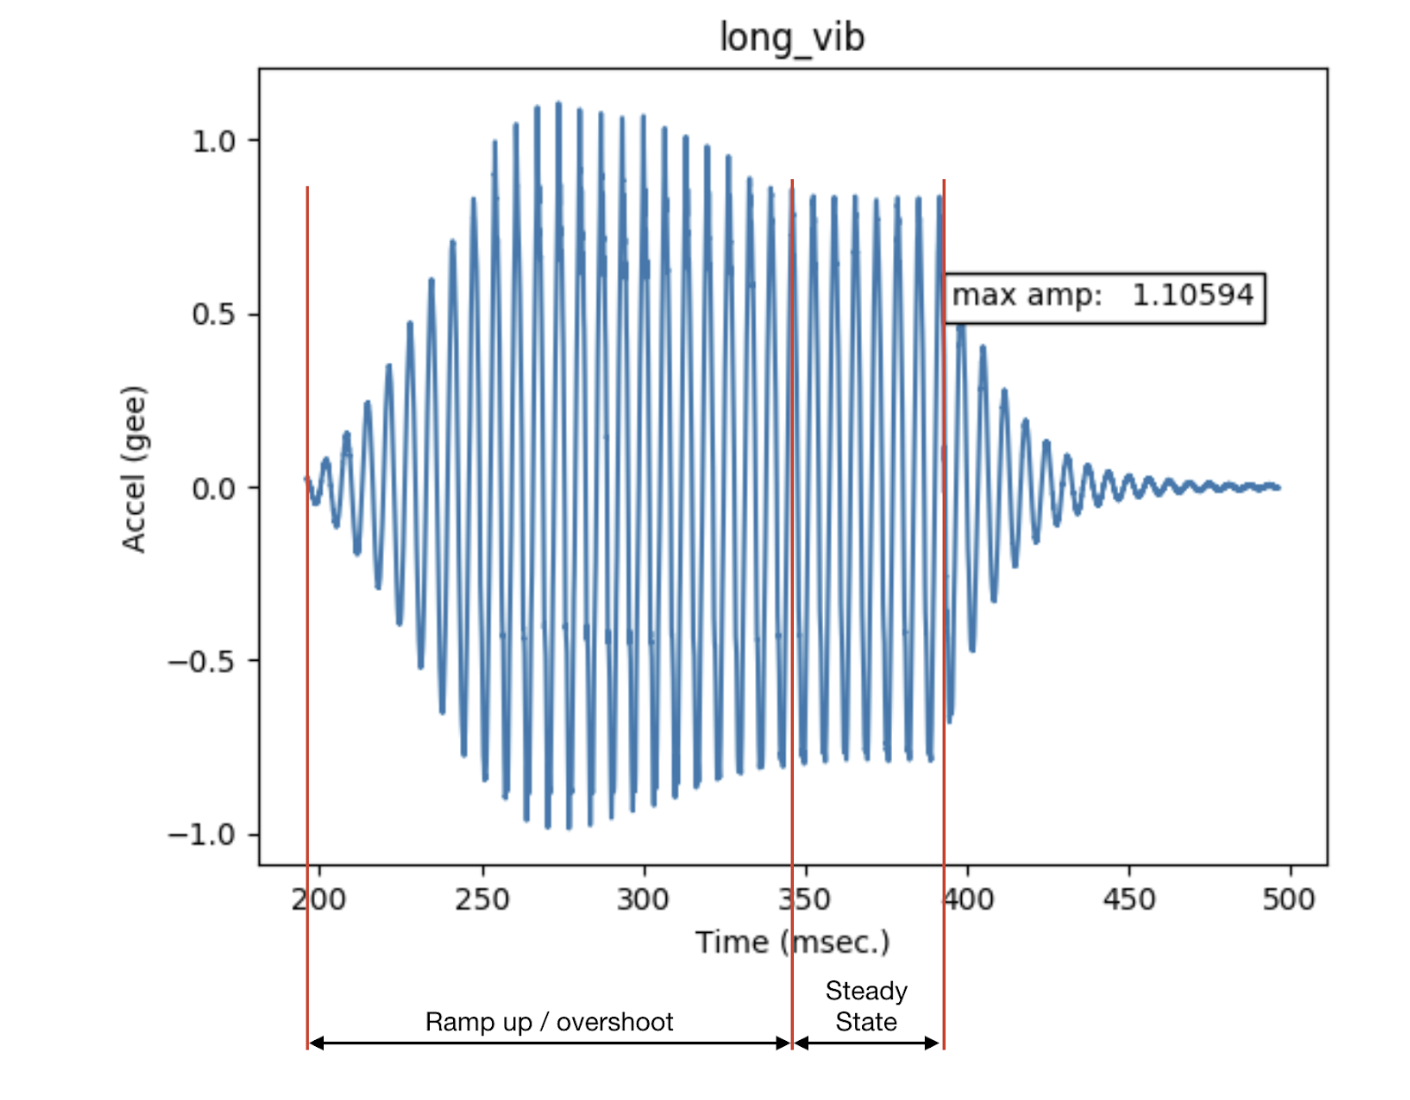
特效 3 的最大振幅
圖 7. 執行器超出
這些元素如圖 7 所示:
- 長時間震動
- 在諧振頻率下,線性諧振致動器在施加正弦輸入時的輸出內容。
- 最大振幅
- 超出範圍
- 當致動器離開共振時,就會發生過衝。圖表顯示當振動器以正弦輸入值離開共振時,會發生的行為類型。這是極端過衝的例子。
- 當 LRA 以其共振頻率驅動時,可以觀察到最小或沒有過衝。LRA 的典型諧振頻率介於 50 和 250 Hz 之間。
這個頁面中的內容和程式碼範例均受《內容授權》中的授權所規範。Java 與 OpenJDK 是 Oracle 和/或其關係企業的商標或註冊商標。
上次更新時間:2025-07-27 (世界標準時間)。
[[["容易理解","easyToUnderstand","thumb-up"],["確實解決了我的問題","solvedMyProblem","thumb-up"],["其他","otherUp","thumb-up"]],[["缺少我需要的資訊","missingTheInformationINeed","thumb-down"],["過於複雜/步驟過多","tooComplicatedTooManySteps","thumb-down"],["過時","outOfDate","thumb-down"],["翻譯問題","translationIssue","thumb-down"],["示例/程式碼問題","samplesCodeIssue","thumb-down"],["其他","otherDown","thumb-down"]],["上次更新時間:2025-07-27 (世界標準時間)。"],[],[],null,["# Analyze the waveform\n\nAfter downloading and running the MATLAB files, use the following flowcharts\nto analyze the waveform files recorded in the previous step.\n\n**Figure 1.** Waveform analysis flowchart for Effect 1 and Effect 2\n\n**Figure 2.** Waveform analysis flowchart for Effect 3\n\n### Failure cases\n\nBefore and during the analysis, check for failure cases (F01--F05).\n\n- Effects designated with **F01** and **F02** can't be processed by MATLAB code.\n- Effects designated with **F03-1** aren't eligible to be added to the performance map, even if they're processed by MATLAB code with no errors.\n- Effects designated with **F03-2** , **F04** , and **F05** can still be added to the performance map, despite failing processing.\n- If [`Vibrator.hasAmplitudeControl()`](https://developer.android.com/reference/android/os/Vibrator#hasAmplitudeControl()) returns `false`, the DUT is designated as either **F04** or **F05**.\n- If there's a noticeable delay (more than 500 ms) after clicking the Effect 3 button during the measurement, the DUT earns an **F04** designation.\n\n| **Failure code** | **Description of failure** | **Applicable effects** | **Reason for failure** | **Fix for failure** |\n|------------------|--------------------------------------------------------------------------------------------------------------------------------------------------------------------------------------------|------------------------|-------------------------------------------------------------------------------------------------------------------------------------------------------------------|------------------------------------------------------------------------------------------------------------------------------------------------------|\n| F01 | No output signal is recorded. | Effect 1 | Haptic feedback constant isn't implemented. | Implement the empty constant as described in [Implement constants](/docs/core/interaction/haptics/haptics-constants-primitives#implement-constants). |\n| F02 | MATLAB code error. The example for the MATLAB error is: \u003cbr /\u003e *Index exceeds matrix dimensions.* | Effect 1, Effect 2 | The amplitude of the haptic effect is too weak. | Increase the amplitude of the haptic effect. |\n| F03-1, F03-2 | \\[F03-1\\] No MATLAB error, but PRR populated from the MATLAB code is smaller than 0. \u003cbr /\u003e \\[F03-2\\] No MATLAB error, but amplitude populated from the MATLAB code is smaller than 0.1 g. | Effect 1, Effect 2 | The amplitude of the haptic effect is too weak. | Increase the amplitude of the haptic effect. |\n| F04 | Signal is is too short (around 500 ms rather than 1000 ms). | Effect 3 | The device fails to generate scaled amplitude properly. The first 500 ms phase amplitude is generated with 0% amplitude even though 50% amplitude was called for. | Enable amplitude scale capabilities. |\n| F05 | The two max amplitude values have little or no difference. | Effect 3 | The device fails to generate scaled amplitude properly. | Enable amplitude scale capabilities. |\n\n**Figure 3.** MATLAB signal plot examples for F03-1 (left) and F03-2 (right)\n\n**Figure 4.** MATLAB signal plot examples for F04 (left) and F05 (right)\n\n### Acquire data from the analysis\n\nWhen running MATLAB code for each effect, you can read the results displayed in\nthe Command Window of the MATLAB software.\n\n**Figure 5.** MATLAB results example in Command Window, Effect 1 (first) and\nEffect 3 (second)\n\n- Effect 1 and Effect 2 (short impulse)\n\n - Peak duration (ms)\n - Peak amplitude (g)\n - PRR to calculate figure of metrics for sharpness (FOMS = PRR/peak duration)\n- Effect 3 (long vibration)\n\n - Maximum amplitude (g) for two phases\n\n[Comparing results using the performance map](/docs/core/interaction/haptics/compare)\nincludes the same set of data acquired from the representative devices in\nthe Android ecosystem, so that you can populate the performance map accordingly.\nThis helps you understand the whole ecosystem and align your data with the\nperformance map data for comparison.\n\nUse the following table to get an idea of how your DUT compares to other phones\nor tablets in the Android ecosystem. A specific question structured around that\nnotion looks like this: *Compared to other Android phones with similar\ncharacteristics (like price tier), is my phone performing better or worse than\nother phones?*\n\n| \\[Input\\] Effects to analyze | \\[Output\\] Peak/maximum amplitude (G) | \\[Output\\] Peak duration (ms) | \\[Output\\] Pulse-to-ring ratio (PRR) |\n|------------------------------------------------------------------------------------------------------|---------------------------------------|-------------------------------|--------------------------------------|\n| Effect 1: Predefined haptic constants (`VibrationEffect.EFFECT_CLICK`) | **\\[1\\] Data 1-1** | **\\[2\\] Data 1-2** | **\\[3\\] Data 1-3** |\n| Effect 2: Short custom haptic effect (duration = 20 ms, amplitude = 100%) | **\\[4\\] Data 2-1** | **\\[5\\] Data 2-2** | **\\[6\\] Data 2-3** |\n| Effect 3-1: Long custom haptic effect Acceleration phase 1 with 50% amplitude for the first 500 ms | **\\[7\\] Data 3-1** | n/a | n/a |\n| Effect 3-2: Long custom haptic effect Acceleration phase 2 with 100% amplitude for the second 500 ms | **\\[8\\] Data 3-2** | n/a | n/a |\n\n### Pulse to ring ratio and peak amplitude for Effect 1 and Effect 2\n\nTwo key parameters measured in Effect 1 and Effect 2 are **pulse to ring ratio\n(PRR)** and **peak amplitude** . These parameters are based on the acceleration\nmeasurement made by the\n[accelerometer setup](/docs/core/interaction/haptics/test-equipment#set-up-equipment).\n\nPRR is calculated by taking the ratio of *main pulse* to ringing amplitude.\n*Duration* is the elapsed time for the main pulse. The formula for PRR is: \n$$ \\\\text{Pulse to ring ratio (PRR)} = 20log_{10}\\\\frac{\\\\text{RMS (main pulse)}}{\\\\text{RMS (ring)}} $$\n\n**Figure 6.** Simulated accel signal\n\nThese elements are illustrated in Figure 6:\n\n- **Main pulse:** Defined by the signal inside the duration window where the amplitude decreases to 10% of peak amplitude.\n- **Ring time:** Defined by the signal where the amplitude decreases from\n 10% peak amplitude to less than 1% of the peak amplitude.\n\n | **Note:** In the example, the amplitude decreased to less than 1% of peak amplitude at around 0.1s.\n- Calculate the **PRR** and **duration**: Create a curve fit that uses\n peak points of each acceleration period. Curve fitting is the best method\n to do this as it improves test repeatability by minimizing noise effects.\n\n### Maximum amplitude for Effect 3\n\n**Figure 7.** Actuator overshoot\n\nThese elements are illustrated in Figure 7:\n\n- **Long vibration**\n - The output from the linear resonant actuator when a sinusoidal input is applied, at the resonant frequency.\n- **Maximum amplitude**\n - The maximum amplitude of the long vibration, when the device vibration is at a steady state.\n- **Overshoot**\n - Overshoot occurs when the actuator is driven away from its resonance. The figure shows the type of behavior that occurs when the vibrator is driven away from the resonance with a sinusoidal input. This is an example of *extreme overshoot*.\n - Minimal or no overshoot can be observed when the LRA is driven at its resonant frequency. Typical resonant frequencies of the LRA are between 50 and 250 Hz."]]