2025 年 3 月 27 日より、AOSP のビルドとコントリビューションには aosp-main
ではなく android-latest-release
を使用することをおすすめします。詳細については、AOSP の変更をご覧ください。
波形を分析する
コレクションでコンテンツを整理
必要に応じて、コンテンツの保存と分類を行います。
MATLAB ファイルをダウンロードして実行した後、以下のフローチャートを使って、前の手順で記録した波形ファイルを分析します。
図 1.効果 1 と効果 2 の波形分析フローチャート
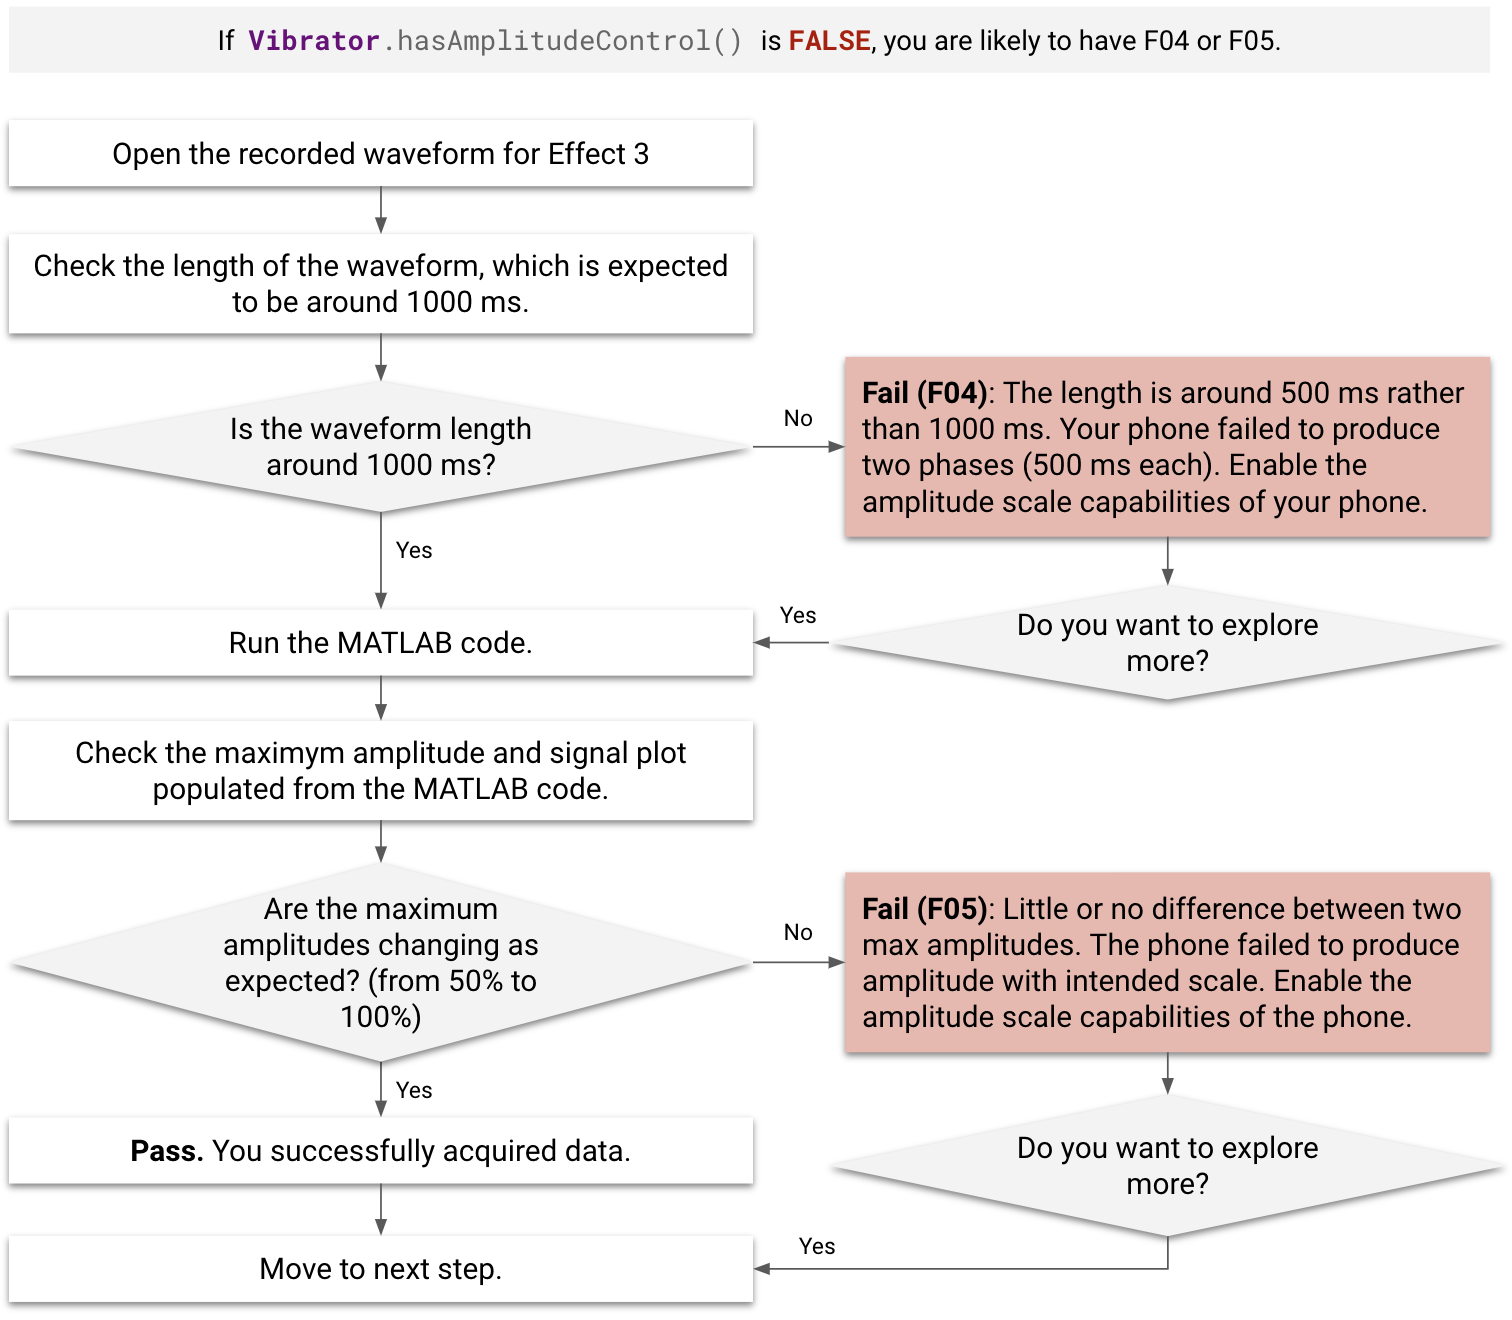
図 2.効果 3 の波形分析フローチャート
失敗ケース
分析の前や分析中に、失敗ケース(F01~F05)があるかどうかを確認します。
- F01 および F02 と表示された効果は、MATLAB コードでは処理できません。
- F03-1 と表示された効果は、MATLAB コードの処理でエラーが出ていない場合であっても、パフォーマンス マップへの追加の対象にはなりません。
- F03-2、F04、F05 と表示された効果は、処理が失敗してもパフォーマンス マップに追加できます。
Vibrator.hasAmplitudeControl()
が false
を返した場合、DUT は F04 または F05 と表示されます。
- 測定中に [効果 3] ボタンをクリックした後に、明確に認識できる遅延(500 ミリ秒以上)が発生すると、DUT は F04 になります。
失敗コード |
失敗の説明 |
該当する効果 |
失敗の理由 |
失敗の修正方法 |
F01 |
出力信号が記録されていません。 |
効果 1 |
触覚フィードバック定数が実装されていません。 |
定数を実装する に記載されているとおり、空の定数を実装します。 |
F02 |
MATLAB コードのエラー。MATLAB のエラーの例を以下に示します:
インデックスが行列のサイズを超えています。 |
効果 1、効果 2 |
触覚効果の振幅が弱すぎます。 |
触覚効果の振幅を大きくします。 |
F03-1、F03-2 |
[F03-1] MATLAB のエラーはありませんが、MATLAB コードから入力された PRR が 0 より小さくなっています。
[F03-2] MATLAB のエラーはありませんが、MATLAB コードから入力された振幅が 0.1g より小さくなっています。 |
効果 1、効果 2 |
触覚効果の振幅が弱すぎます。 |
触覚効果の振幅を大きくします。 |
F04 |
信号が短すぎます(1,000 ミリ秒ではなく約 500 ミリ秒)。 |
効果 3 |
デバイスは、振幅を正しくスケーリングして生成できていません。最初の 500 ミリ秒フェーズの振幅は、50% の振幅が必要なのにもかかわらず 0% で生成されています。 |
振幅のスケーリング機能を有効にします。 |
F05 |
2 つの最大振幅値にほとんど違いがありません。 |
効果 3 |
デバイスは、振幅を正しくスケーリングして生成できていません。 |
振幅のスケーリング機能を有効にします。 |
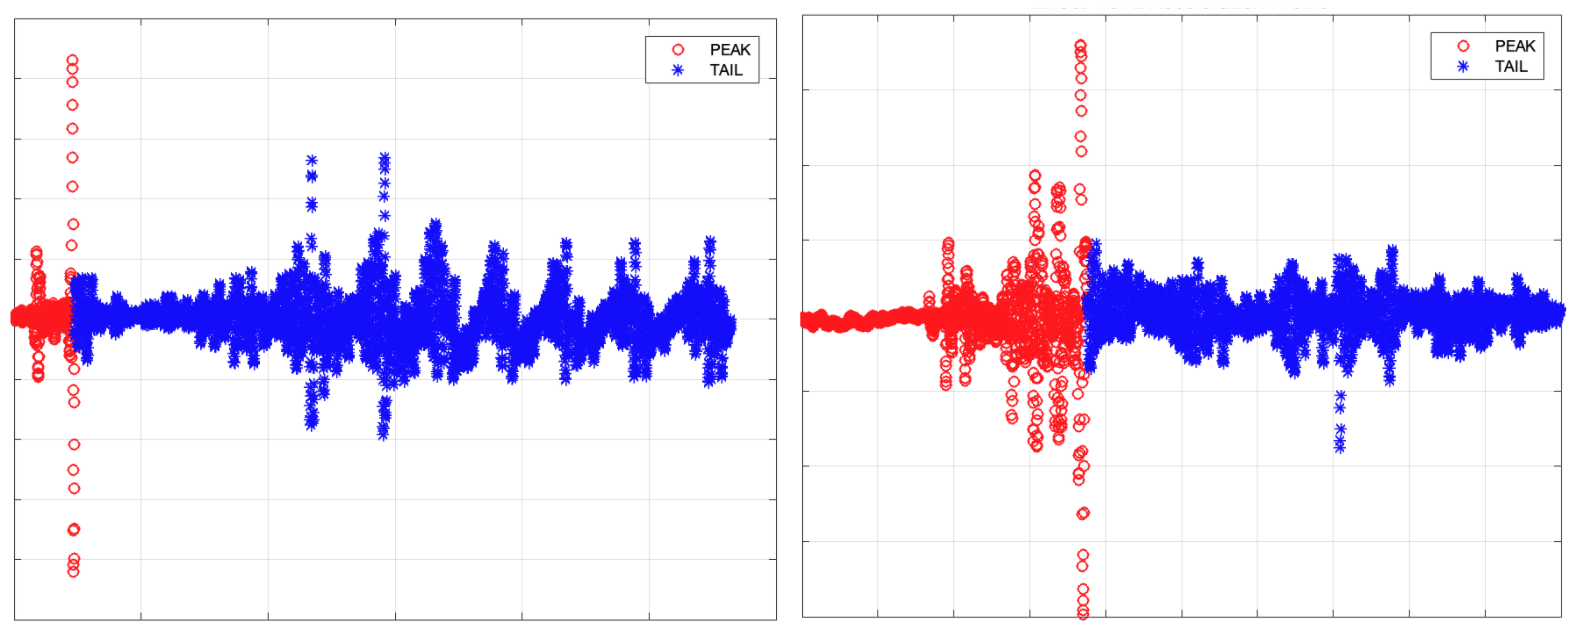
図 3.F03-1(左)と F03-2(右)の MATLAB の信号プロットの例
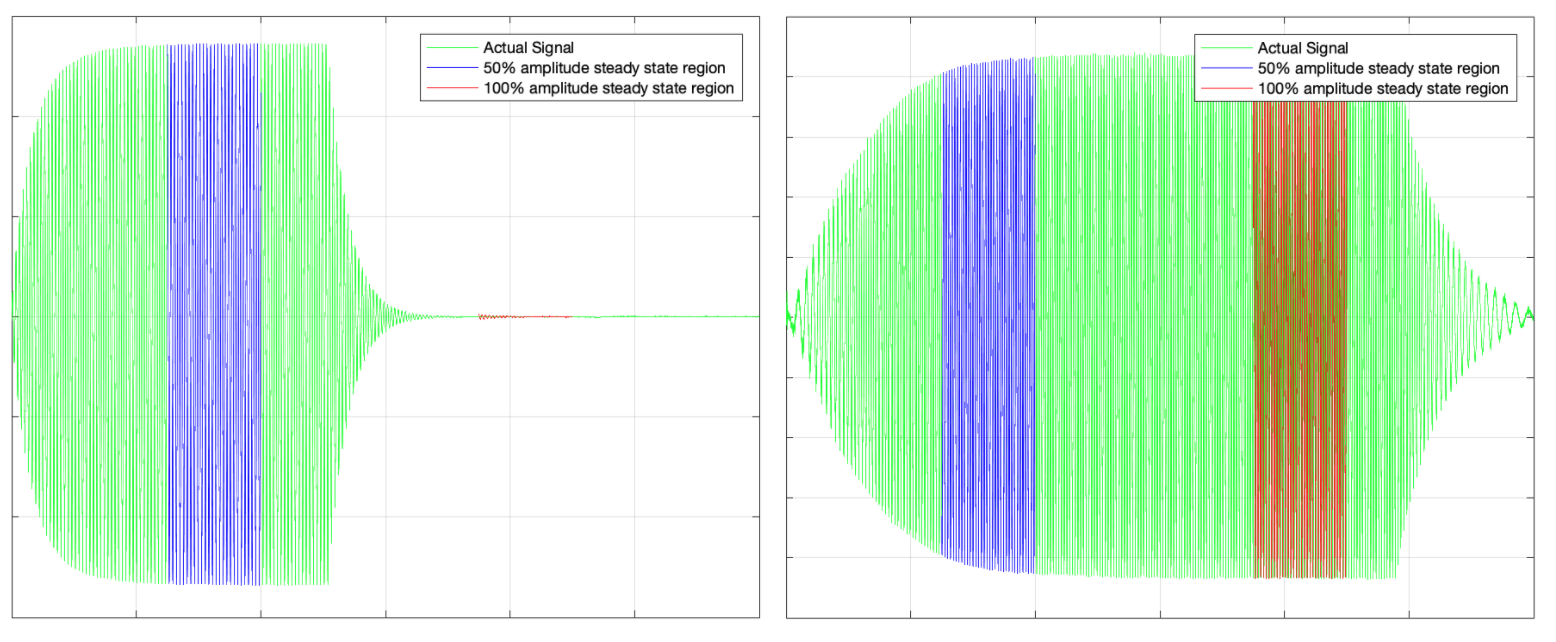
図 4.F04(左)と F05(右)の MATLAB の信号プロットの例
分析からデータを取得する
各効果の MATLAB コードを実行すると、MATLAB ソフトウェアのコマンド ウィンドウで結果を確認できます。
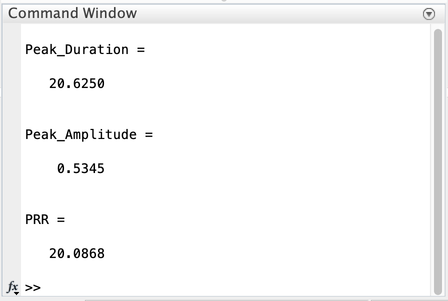
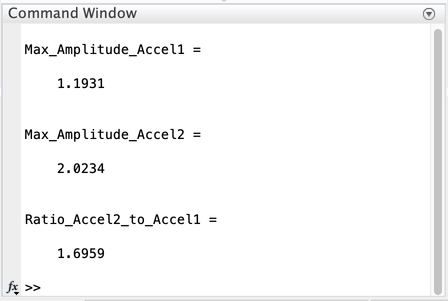
図 5.コマンド ウィンドウに表示された MATLAB 結果の例。効果 1(1 つ目)と効果 3(2 つ目)
効果 1 と効果 2(短いインパルス)
- ピーク時間(ミリ秒)
- ピーク振幅(g)
- シャープネスの指標値(FOMS = PRR ÷ ピーク時間)を計算するための PRR
効果 3(長いバイブレーション)
パフォーマンス マップを使って結果を比較すると、Android エコシステムの代表的なデバイスから取得した同一のデータセットが含まれるため、パフォーマンス マップへ適宜データを入力できます。これにより、エコシステム全体を理解し、データをパフォーマンス マップのデータと照らし合わせて比較できます。
以下の表を使って、DUT が Android エコシステムの他のスマートフォンやタブレットと比較してどの程度優れているかを確認します。この考えに基づいた具体的な質問例は次のようになります。「似たような特性(価格帯など)を持つ他の Android スマートフォンと比較して、自分のスマートフォンのパフォーマンスは他のスマートフォンより優れているか、劣っているか?」
[入力]
分析する効果 |
[出力]
ピーク / 最大振幅(G) |
[出力] ピーク時間(ミリ秒) |
[出力]
パルス対リング比(PRR) |
効果 1: 事前に定義済みの触覚定数(VibrationEffect.EFFECT_CLICK ) |
[1] データ 1-1 |
[2] データ 1-2 |
[3] データ 1-3 |
効果 2: 短いカスタム触覚効果(時間 = 20 ミリ秒、振幅 = 100%) |
[4] データ 2-1 |
[5] データ 2-2 |
[6] データ 2-3 |
効果 3-1: 長いカスタム触覚効果、最初の 500 ミリ秒は振幅 50% のアクセラレーション フェーズ 1 |
[7] データ 3-1 |
なし |
なし |
効果 3-2: 長いカスタム触覚効果、次の 500 ミリ秒は振幅 100% のアクセラレーション フェーズ 2 |
[8] データ 3-2 |
なし |
なし |
効果 1 と効果 2 のパルス対リング比とピーク振幅
効果 1 と効果 2 で測定される 2 つの主要パラメータは、パルス対リング比(PRR)とピーク振幅です。これらのパラメータは、加速度計の設定による加速度測定に基づいています。
PRR は、リング時振幅に対するメインパルスの比率を使って計算されます。
時間は、メインパルスの経過時間です。PRR の数式:
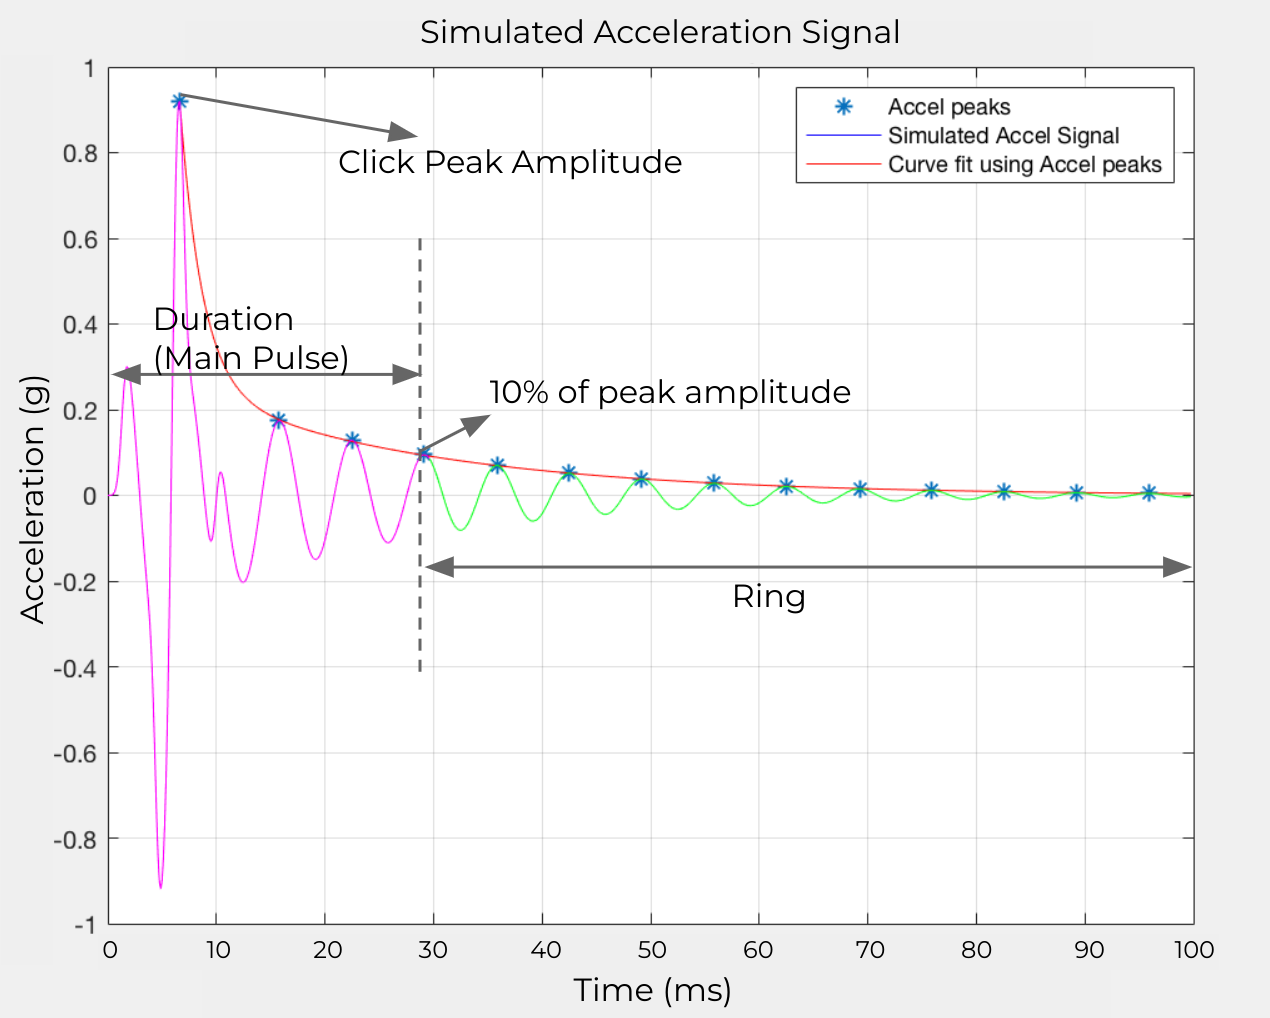
$$
\text{Pulse to ring ratio (PRR)} = 20log_{10}\frac{\text{RMS (main pulse)}}{\text{RMS (ring)}}
$$
図 6.加速度信号のシミュレーション
以下の要素が図 6 に示されています。
効果 3 の最大振幅
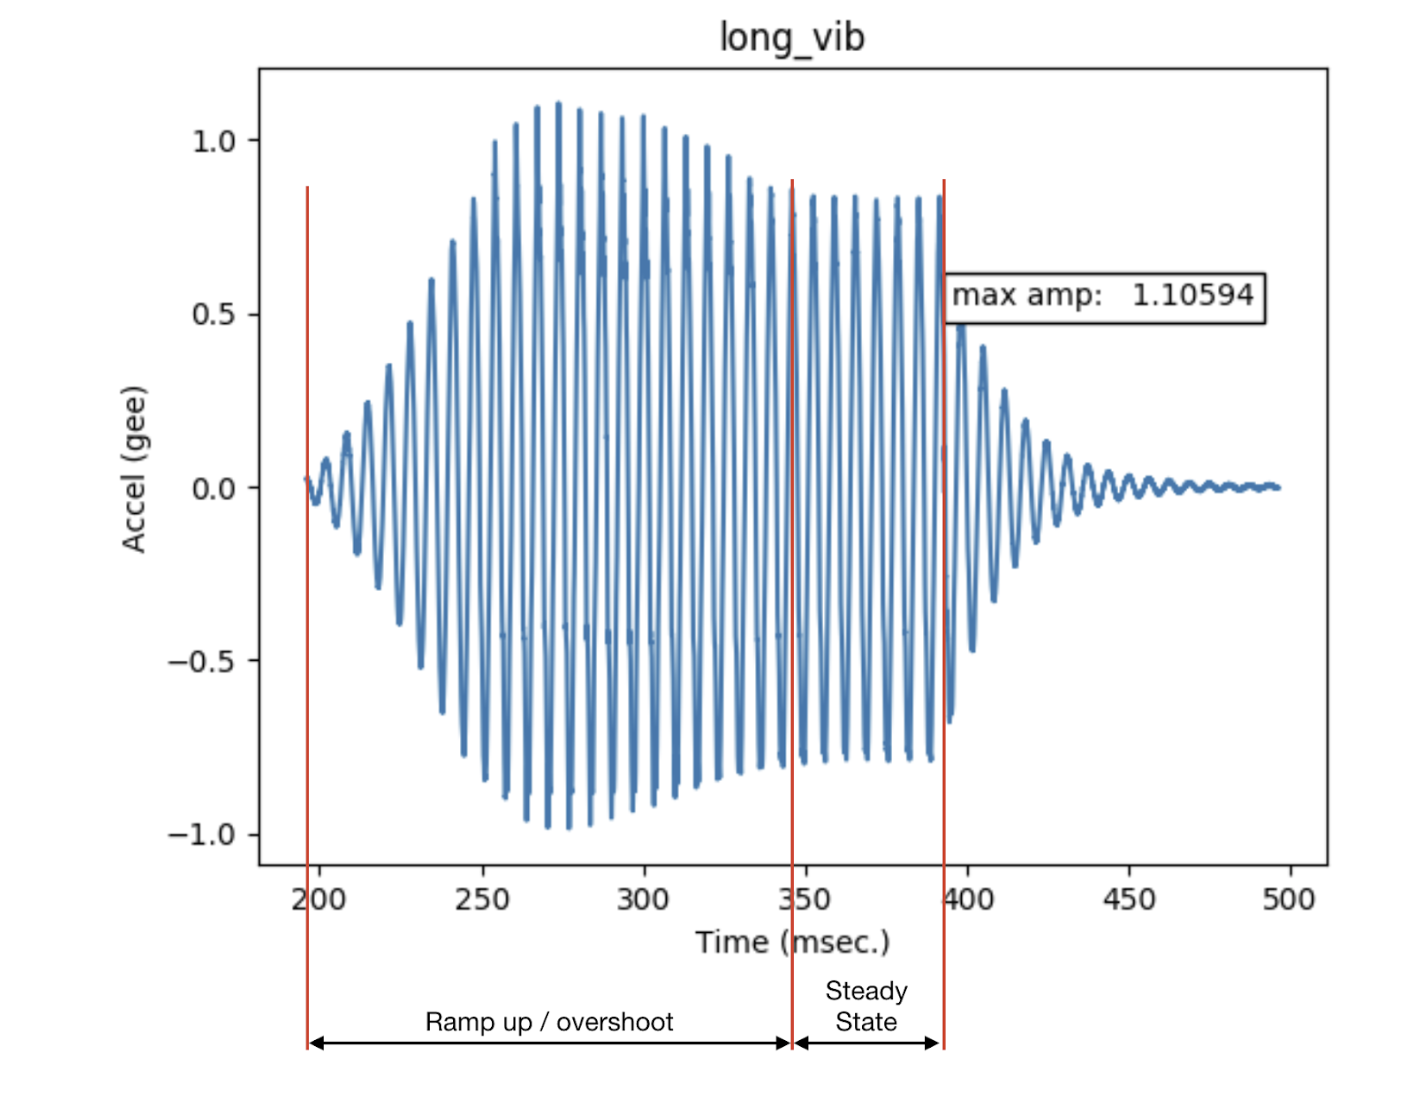
図 7. アクチュエータのオーバーシュート
以下の要素が図 7 に示されています。
- 長いバイブレーション
- 共振周波数で正弦波を入力したときのリニア共振アクチュエータの出力。
- 最大振幅
- デバイスのバイブレーションが安定状態にあるときの長いバイブレーションの最大振幅。
- オーバーシュート
- オーバーシュートは、アクチュエータが共振から離れるときに発生します。図は、正弦波を入力している状態でバイブレータが共振から離れたときに起こる様子を示しています。これは、極端なオーバーシュートの例です。
- LRA が共振周波数で駆動している場合は、オーバーシュートは最小限に抑えられるか、発生しません。LRA の一般的な共振周波数は 50~250 Hz です。
このページのコンテンツやコードサンプルは、コンテンツ ライセンスに記載のライセンスに従います。Java および OpenJDK は Oracle および関連会社の商標または登録商標です。
最終更新日 2025-03-10 UTC。
[[["わかりやすい","easyToUnderstand","thumb-up"],["問題の解決に役立った","solvedMyProblem","thumb-up"],["その他","otherUp","thumb-up"]],[["必要な情報がない","missingTheInformationINeed","thumb-down"],["複雑すぎる / 手順が多すぎる","tooComplicatedTooManySteps","thumb-down"],["最新ではない","outOfDate","thumb-down"],["翻訳に関する問題","translationIssue","thumb-down"],["サンプル / コードに問題がある","samplesCodeIssue","thumb-down"],["その他","otherDown","thumb-down"]],["最終更新日 2025-03-10 UTC。"],[],[],null,["# Analyze the waveform\n\nAfter downloading and running the MATLAB files, use the following flowcharts\nto analyze the waveform files recorded in the previous step.\n\n**Figure 1.** Waveform analysis flowchart for Effect 1 and Effect 2\n\n**Figure 2.** Waveform analysis flowchart for Effect 3\n\n### Failure cases\n\nBefore and during the analysis, check for failure cases (F01--F05).\n\n- Effects designated with **F01** and **F02** can't be processed by MATLAB code.\n- Effects designated with **F03-1** aren't eligible to be added to the performance map, even if they're processed by MATLAB code with no errors.\n- Effects designated with **F03-2** , **F04** , and **F05** can still be added to the performance map, despite failing processing.\n- If [`Vibrator.hasAmplitudeControl()`](https://developer.android.com/reference/android/os/Vibrator#hasAmplitudeControl()) returns `false`, the DUT is designated as either **F04** or **F05**.\n- If there's a noticeable delay (more than 500 ms) after clicking the Effect 3 button during the measurement, the DUT earns an **F04** designation.\n\n| **Failure code** | **Description of failure** | **Applicable effects** | **Reason for failure** | **Fix for failure** |\n|------------------|--------------------------------------------------------------------------------------------------------------------------------------------------------------------------------------------|------------------------|-------------------------------------------------------------------------------------------------------------------------------------------------------------------|------------------------------------------------------------------------------------------------------------------------------------------------------|\n| F01 | No output signal is recorded. | Effect 1 | Haptic feedback constant isn't implemented. | Implement the empty constant as described in [Implement constants](/docs/core/interaction/haptics/haptics-constants-primitives#implement-constants). |\n| F02 | MATLAB code error. The example for the MATLAB error is: \u003cbr /\u003e *Index exceeds matrix dimensions.* | Effect 1, Effect 2 | The amplitude of the haptic effect is too weak. | Increase the amplitude of the haptic effect. |\n| F03-1, F03-2 | \\[F03-1\\] No MATLAB error, but PRR populated from the MATLAB code is smaller than 0. \u003cbr /\u003e \\[F03-2\\] No MATLAB error, but amplitude populated from the MATLAB code is smaller than 0.1 g. | Effect 1, Effect 2 | The amplitude of the haptic effect is too weak. | Increase the amplitude of the haptic effect. |\n| F04 | Signal is is too short (around 500 ms rather than 1000 ms). | Effect 3 | The device fails to generate scaled amplitude properly. The first 500 ms phase amplitude is generated with 0% amplitude even though 50% amplitude was called for. | Enable amplitude scale capabilities. |\n| F05 | The two max amplitude values have little or no difference. | Effect 3 | The device fails to generate scaled amplitude properly. | Enable amplitude scale capabilities. |\n\n**Figure 3.** MATLAB signal plot examples for F03-1 (left) and F03-2 (right)\n\n**Figure 4.** MATLAB signal plot examples for F04 (left) and F05 (right)\n\n### Acquire data from the analysis\n\nWhen running MATLAB code for each effect, you can read the results displayed in\nthe Command Window of the MATLAB software.\n\n**Figure 5.** MATLAB results example in Command Window, Effect 1 (first) and\nEffect 3 (second)\n\n- Effect 1 and Effect 2 (short impulse)\n\n - Peak duration (ms)\n - Peak amplitude (g)\n - PRR to calculate figure of metrics for sharpness (FOMS = PRR/peak duration)\n- Effect 3 (long vibration)\n\n - Maximum amplitude (g) for two phases\n\n[Comparing results using the performance map](/docs/core/interaction/haptics/compare)\nincludes the same set of data acquired from the representative devices in\nthe Android ecosystem, so that you can populate the performance map accordingly.\nThis helps you understand the whole ecosystem and align your data with the\nperformance map data for comparison.\n\nUse the following table to get an idea of how your DUT compares to other phones\nor tablets in the Android ecosystem. A specific question structured around that\nnotion looks like this: *Compared to other Android phones with similar\ncharacteristics (like price tier), is my phone performing better or worse than\nother phones?*\n\n| \\[Input\\] Effects to analyze | \\[Output\\] Peak/maximum amplitude (G) | \\[Output\\] Peak duration (ms) | \\[Output\\] Pulse-to-ring ratio (PRR) |\n|------------------------------------------------------------------------------------------------------|---------------------------------------|-------------------------------|--------------------------------------|\n| Effect 1: Predefined haptic constants (`VibrationEffect.EFFECT_CLICK`) | **\\[1\\] Data 1-1** | **\\[2\\] Data 1-2** | **\\[3\\] Data 1-3** |\n| Effect 2: Short custom haptic effect (duration = 20 ms, amplitude = 100%) | **\\[4\\] Data 2-1** | **\\[5\\] Data 2-2** | **\\[6\\] Data 2-3** |\n| Effect 3-1: Long custom haptic effect Acceleration phase 1 with 50% amplitude for the first 500 ms | **\\[7\\] Data 3-1** | n/a | n/a |\n| Effect 3-2: Long custom haptic effect Acceleration phase 2 with 100% amplitude for the second 500 ms | **\\[8\\] Data 3-2** | n/a | n/a |\n\n### Pulse to ring ratio and peak amplitude for Effect 1 and Effect 2\n\nTwo key parameters measured in Effect 1 and Effect 2 are **pulse to ring ratio\n(PRR)** and **peak amplitude** . These parameters are based on the acceleration\nmeasurement made by the\n[accelerometer setup](/docs/core/interaction/haptics/test-equipment#set-up-equipment).\n\nPRR is calculated by taking the ratio of *main pulse* to ringing amplitude.\n*Duration* is the elapsed time for the main pulse. The formula for PRR is: \n$$ \\\\text{Pulse to ring ratio (PRR)} = 20log_{10}\\\\frac{\\\\text{RMS (main pulse)}}{\\\\text{RMS (ring)}} $$\n\n**Figure 6.** Simulated accel signal\n\nThese elements are illustrated in Figure 6:\n\n- **Main pulse:** Defined by the signal inside the duration window where the amplitude decreases to 10% of peak amplitude.\n- **Ring time:** Defined by the signal where the amplitude decreases from\n 10% peak amplitude to less than 1% of the peak amplitude.\n\n | **Note:** In the example, the amplitude decreased to less than 1% of peak amplitude at around 0.1s.\n- Calculate the **PRR** and **duration**: Create a curve fit that uses\n peak points of each acceleration period. Curve fitting is the best method\n to do this as it improves test repeatability by minimizing noise effects.\n\n### Maximum amplitude for Effect 3\n\n**Figure 7.** Actuator overshoot\n\nThese elements are illustrated in Figure 7:\n\n- **Long vibration**\n - The output from the linear resonant actuator when a sinusoidal input is applied, at the resonant frequency.\n- **Maximum amplitude**\n - The maximum amplitude of the long vibration, when the device vibration is at a steady state.\n- **Overshoot**\n - Overshoot occurs when the actuator is driven away from its resonance. The figure shows the type of behavior that occurs when the vibrator is driven away from the resonance with a sinusoidal input. This is an example of *extreme overshoot*.\n - Minimal or no overshoot can be observed when the LRA is driven at its resonant frequency. Typical resonant frequencies of the LRA are between 50 and 250 Hz."]]