
下载并运行 MATLAB 文件后,请使用以下流程图分析在上一步中记录的波形文件。
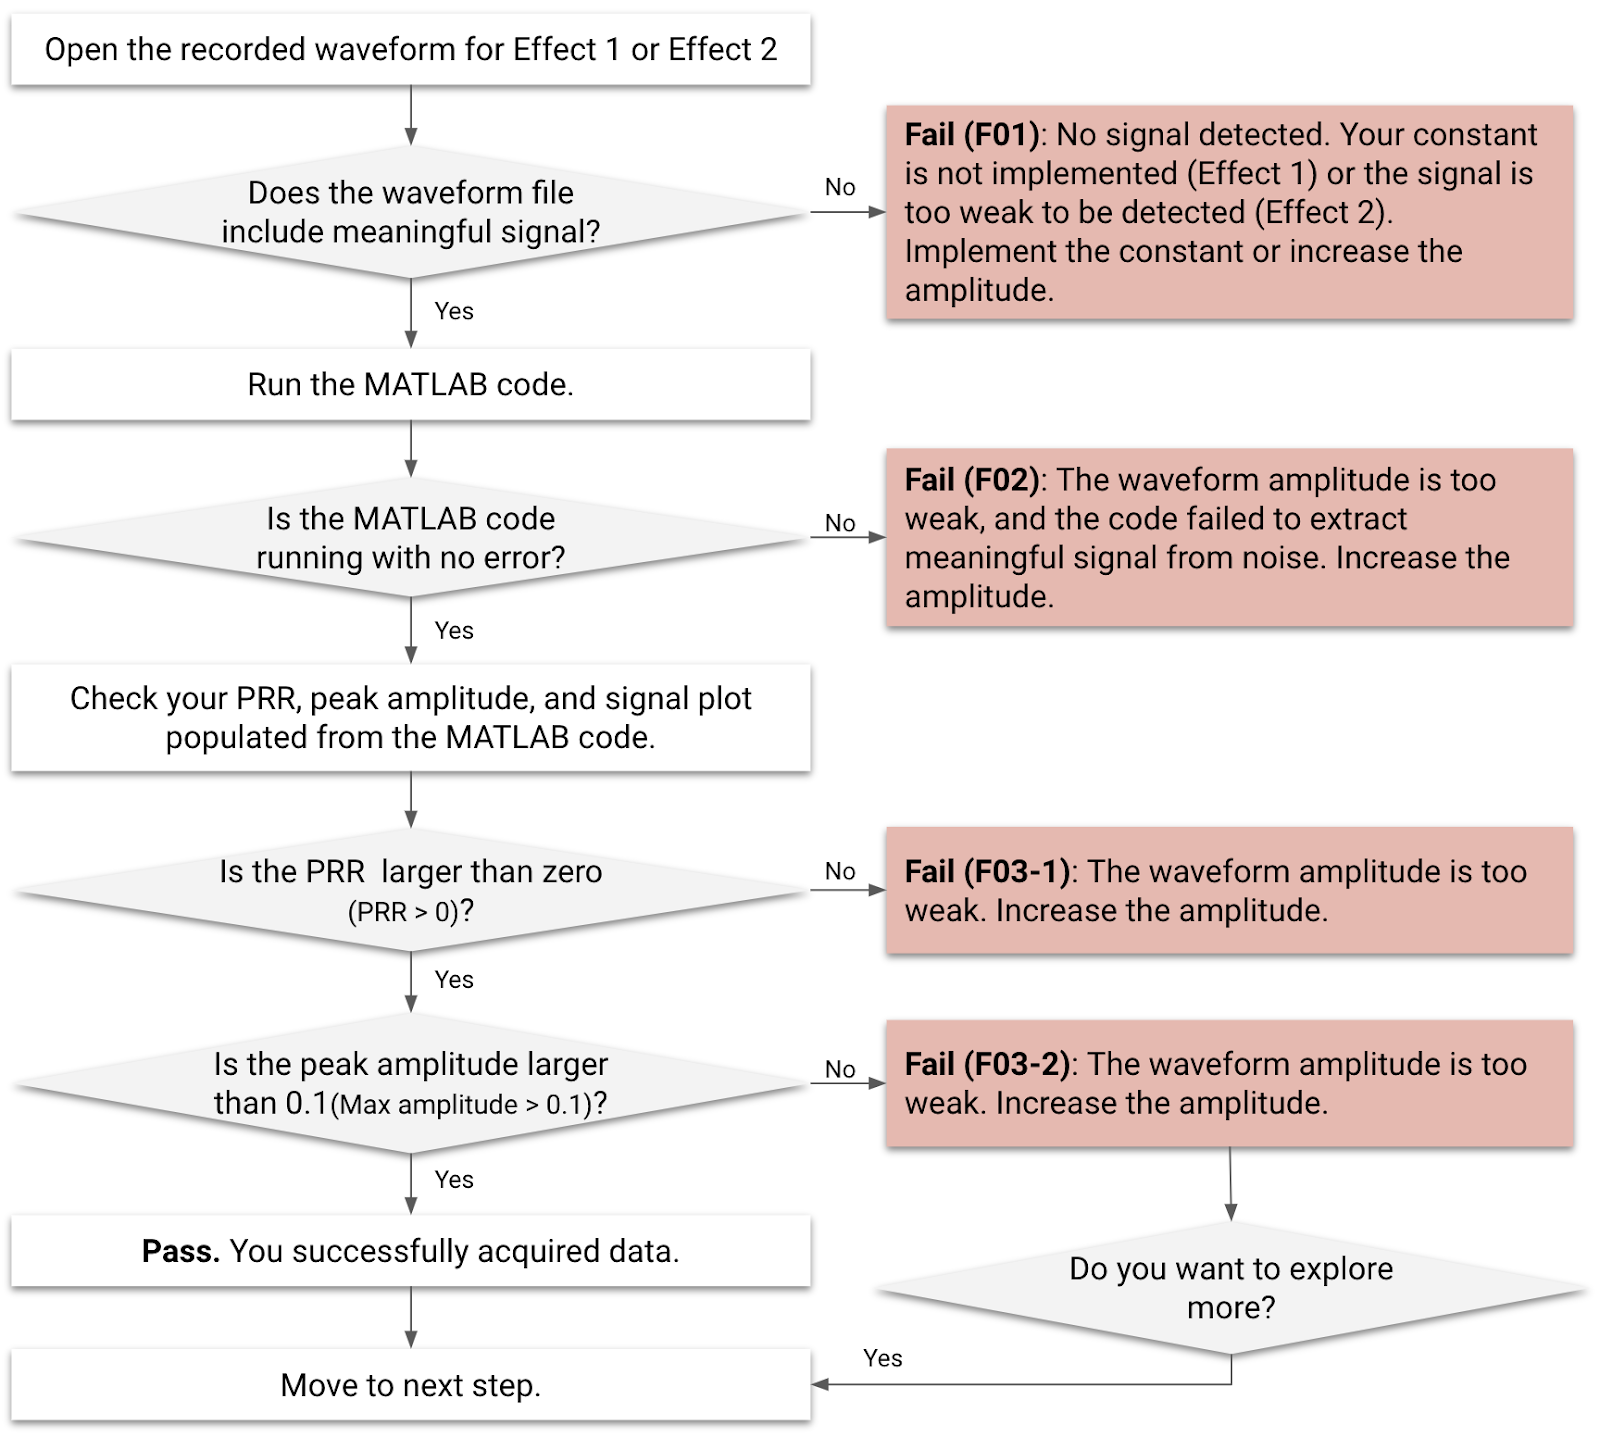
图 1. 效果 1 和效果 2 的波形分析流程图
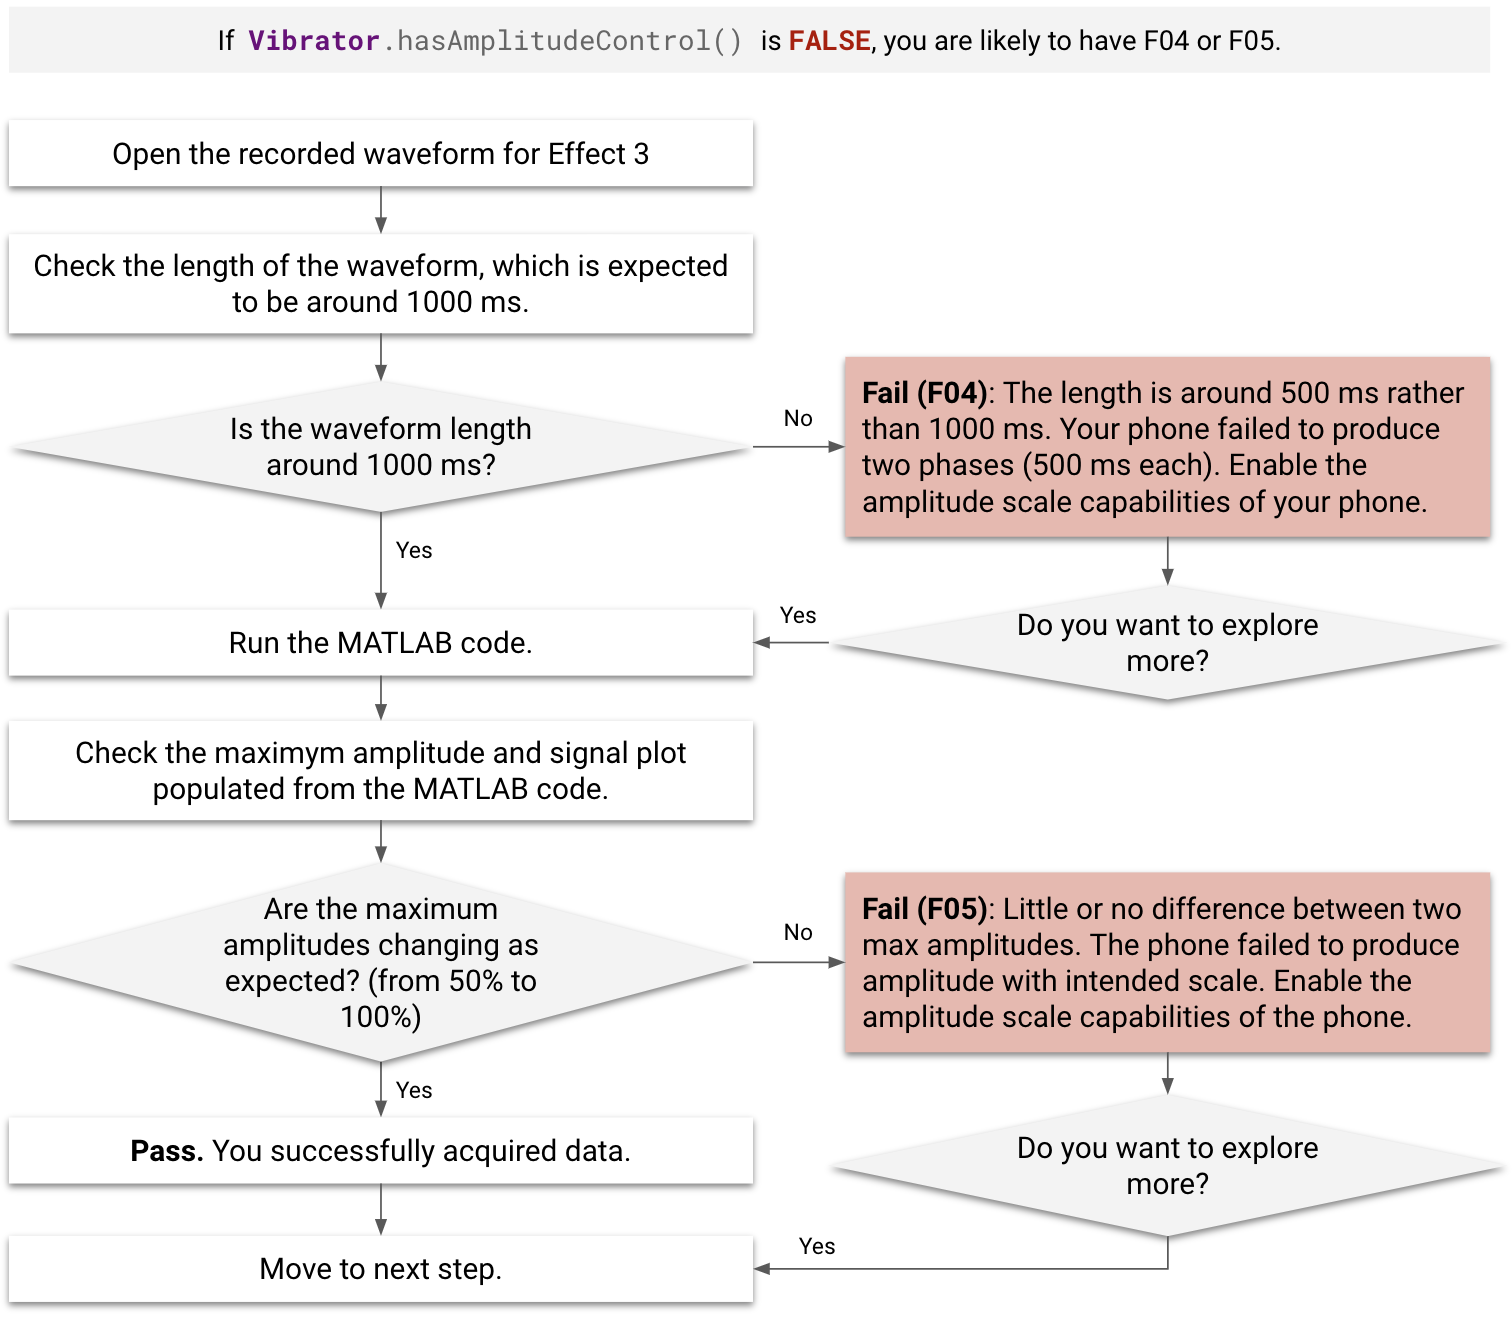
图 2. 效果 3 的波形分析流程图
失败案例
在分析之前和分析期间,请检查失败情况 (F01–F05)。
- MATLAB 代码无法处理 F01 和 F02 指定的效果。
- 使用 F03-1 指定的效果不符合添加到性能图的条件,即使 MATLAB 代码处理这些效果时没有出错也是如此。
- 使用 F03-2、F04 和 F05 指定的效果仍可添加到性能图中,即使处理失败也是如此。
- 如果
Vibrator.hasAmplitudeControl()返回false,则 DUT 被指定为 F04 或 F05。 - 如果在测量期间点击“效果 3”按钮后出现明显延迟(超过 500 毫秒),则 DUT 会被指定为 F04。
| 失败代码 | 失败说明 | 适用的效果 | 失败原因 | 修复失败问题 |
|---|---|---|---|---|
| F01 | 未记录任何输出信号。 | 效果 1 | 未实现触感反馈常量。 | 按照实现常量中的说明实现空常量。 |
| F02 | MATLAB 代码错误。MATLAB 错误的示例: 索引超出矩阵维度。 |
效果 1、效果 2 | 触感反馈效果的振幅太弱。 | 提高触感反馈效果的振幅。 |
| F03-1、F03-2 | [F03-1] 没有 MATLAB 错误,但通过 MATLAB 代码填充的 PRR 小于 0。 [F03-2] 没有 MATLAB 错误,但通过 MATLAB 代码填充的振幅小于 0.1 g。 |
效果 1、效果 2 | 触感反馈效果的振幅太弱。 | 提高触感反馈效果的振幅。 |
| F04 | 信号过短(大约 500 毫秒,而不是 1000 毫秒)。 | 效果 3 | 设备未能正确生成缩放后的振幅。即使调用了 50% 的振幅,系统也会以 0% 的振幅生成前 500 毫秒阶段的振幅。 | 启用振幅缩放功能。 |
| F05 | 这两个最大振幅几乎没有差异。 | 效果 3 | 设备未能正确生成缩放后的振幅。 | 启用振幅缩放功能。 |
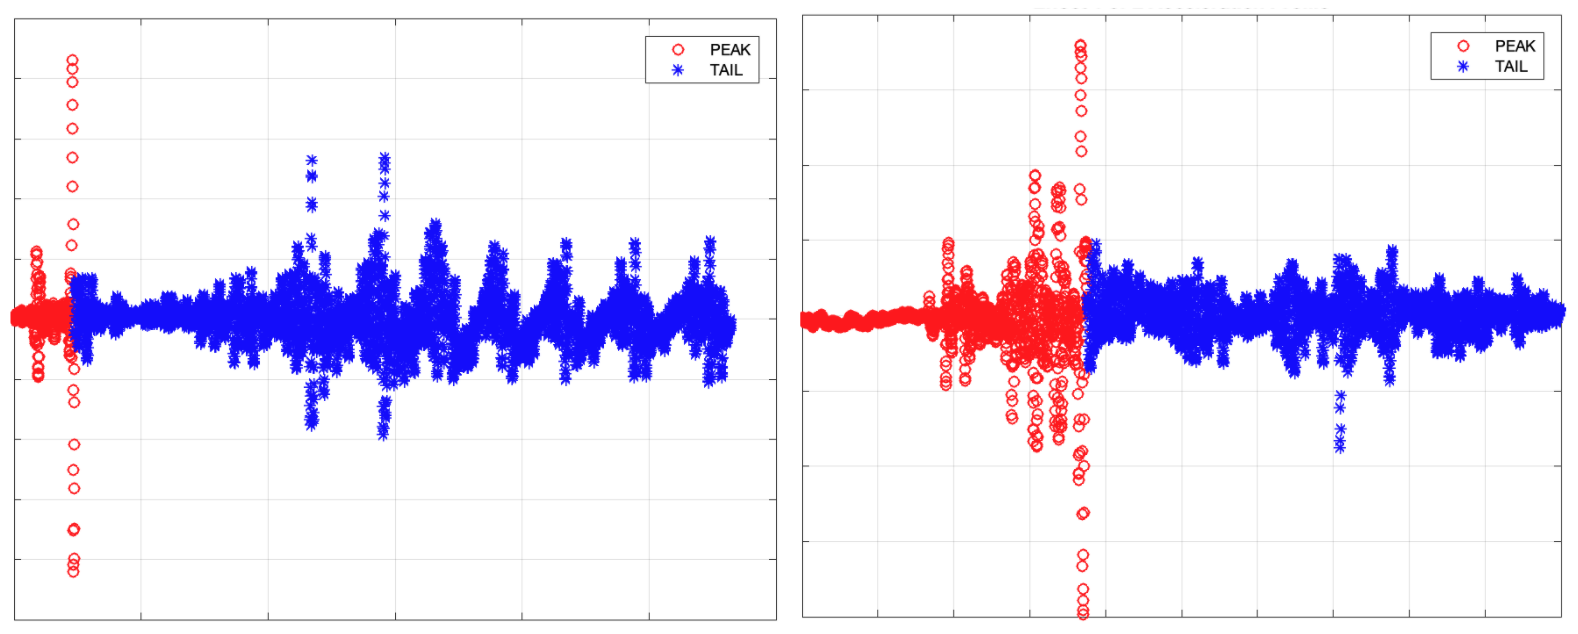
图 3. F03-1(左侧)和 F03-2(右侧)的 MATLAB 信号图示例
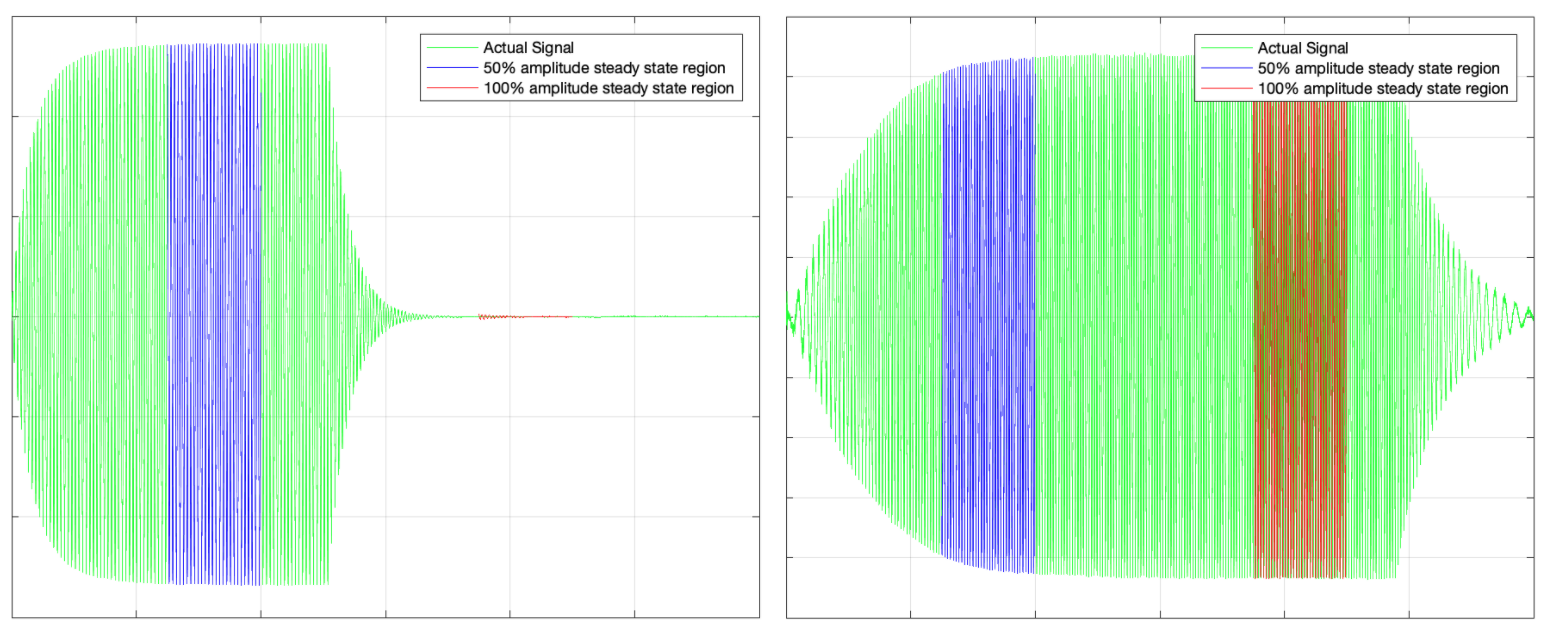
图 4. F04(左侧)和 F05(右侧)的 MATLAB 信号图示例
从分析中获取数据
针对每种效果运行 MATLAB 代码时,您可以读取 MATLAB 软件的命令窗口中显示的结果。
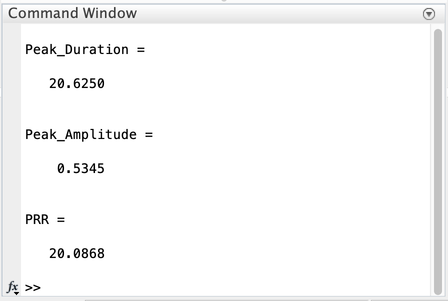
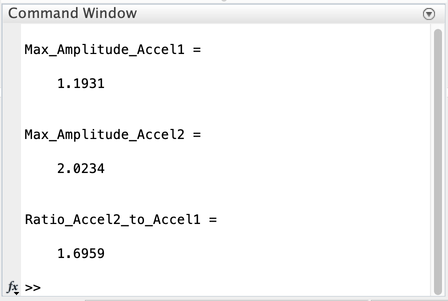
图 5. 命令窗口中的 MATLAB 结果示例:效果 1(第一个)和效果 3(第二个)
效果 1 和效果 2(短脉冲)
- 峰值时长(毫秒)
- 峰值振幅 (G)
- 使用 PRR 计算清晰度指标 (FOMS = PRR/峰值时长)
效果 3(长时间振动)
- 两个阶段的最大振幅 (G)
使用性能图比较结果包含从 Android 生态中的代表性设备获取的同一组数据,以便您可以相应地填充性能图。这有助于您了解整个生态系统,并将您的数据与性能图数据进行比较。
请参阅下表,了解您的 DUT 与 Android 生态系统中的其他手机或平板电脑的比较结果。围绕该概念产生的具体问题类似于:与具有类似特性(例如价格层级)的其他 Android 手机相比,我的手机性能是优是劣?
| [输入] 要分析的效果 |
[输出] 峰值/最大振幅 (G) |
[输出] 峰值时长(毫秒) | [输出] 脉冲到响铃比率 (PRR) |
|---|---|---|---|
效果 1:预定义的触感反馈常量 (VibrationEffect.EFFECT_CLICK) |
[1] 数据 1-1 | [2] 数据 1-2 | [3] 数据 1-3 |
| 效果 2:短时自定义触感反馈效果(时长 = 20 毫秒,振幅 = 100%) | [4] 数据 2-1 | [5] 数据 2-2 | [6] 数据 2-3 |
| 效果 3-1:长时自定义触感反馈效果加速第 1 阶段,第 1 个 500 毫秒的振幅为 50% | [7] 数据 3-1 | 不适用 | 不适用 |
| 效果 3-2:长时自定义触感反馈效果加速第 2 阶段,第 2 个 500 毫秒的振幅为 100% | [8] 数据 3-2 | 不适用 | 不适用 |
效果 1 和效果 2 的脉冲与振铃比率及峰值幅度
效果 1 和效果 2 中测量的两个关键参数是脉冲到响铃比率 (PRR) 和峰值振幅。这些参数基于加速度计设置进行的加速度测量。
PRR 是通过主脉冲与响铃振幅的比率计算得出的。 时长是主脉冲的经过时间。PRR 的计算公式如下:
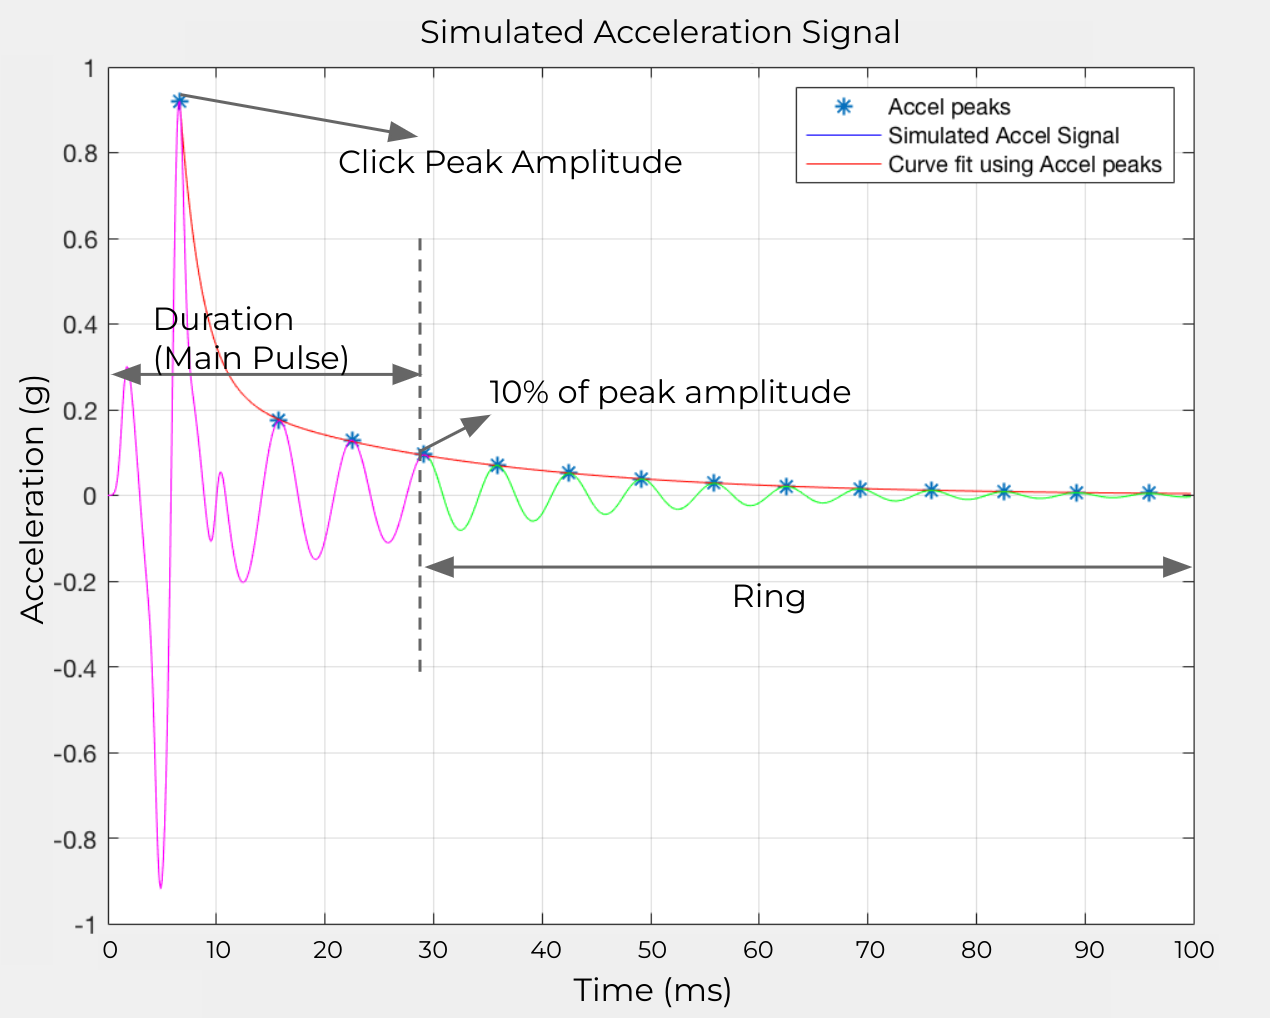
图 6. 模拟加速信号
这些元素如图 6 所示:
- 主脉冲:由振幅下降到峰值振幅的 10% 这段时间内的信号定义。
响铃时间:由振幅从峰值振幅的 10% 下降到低于峰值振幅的 1% 这段时间内的信号定义。
计算 PRR 和持续时间:使用每个加速周期的峰值点创建一个曲线拟合。若要实现此目的,曲线拟合是最佳方法,因为它可以最大限度地减少噪声影响,从而提高测试的可重复性。
效果 3 的最大振幅
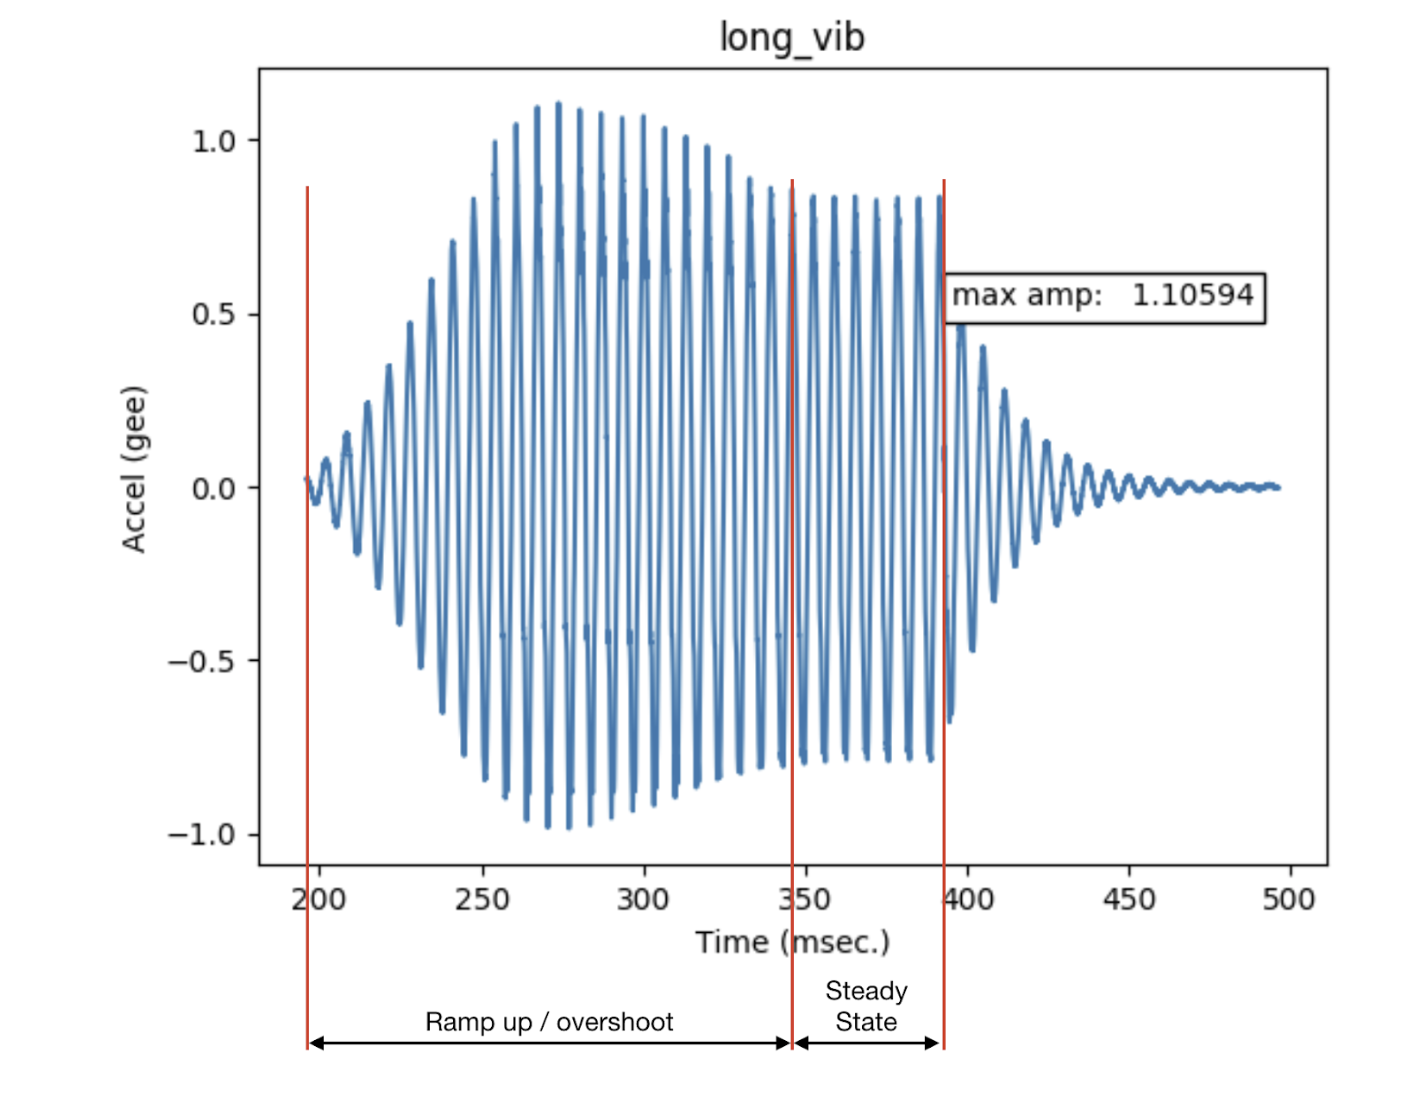
图 7. 致动器过冲
这些元素如图 7 所示:
- 长时间振动
- 以共振频率施加正弦输入时,线性共振致动器的输出。
- 最大振幅
- 当设备振动处于稳定状态时,长时间振动的最大振幅。
- 过冲
- 当致动器偏离共振时,会发生过冲。此图显示了当正弦输入促使振动器偏离共振状态时发生的行为类型。这是极端超调的示例。
- 当 LRA 以其共振频率驱动时,极少会出现或完全不会出现过冲现象。LRA 的典型共振频率介于 50 Hz 到 250 Hz 之间。