2025 年 3 月 27 日より、AOSP のビルドとコントリビューションには aosp-main
ではなく android-latest-release
を使用することをおすすめします。詳細については、AOSP の変更をご覧ください。
VTS ダッシュボードの UI
コレクションでコンテンツを整理
必要に応じて、コンテンツの保存と分類を行います。
VTS ダッシュボードは、マテリアル デザインを使用してテスト結果、プロファイリング、カバレッジに関する情報を効果的に表示する一貫性のあるユーザー インターフェースを備えています。
ダッシュボードの外観には、Google App Engine の Java サーブレットから配信されるデータを処理するために、Materialize CSS や jQueryUI などのオープンソースの JavaScript ライブラリを使用しています。
ダッシュボードのホーム
ダッシュボードのホームページには、ユーザーがお気に入りに追加したテストスイートの一覧が表示されます。
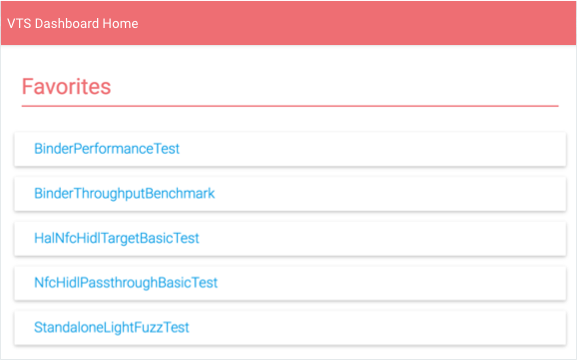
図 1. VTS ダッシュボード、ホームページこのリストから次の操作が可能です。
- テストスイートを選択して、そのスイートの結果を表示する。
- [すべて表示] をクリックして、すべての VTS テスト名を表示する。
- 編集アイコンを選択して、お気に入りリストを変更する。
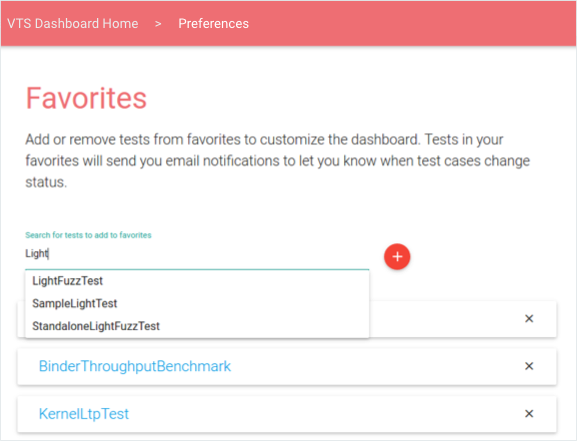
図 2. VTS ダッシュボード、お気に入りページの編集
テスト結果
[Test Results] には、プロファイリング ポイントのリスト、テストケースの結果を時系列で並べた表、最新の実行結果の内訳を示す円グラフなど、選択したテストスイートの最新情報が表示されます(右にページ移動して古いデータを読み込むことができます)。
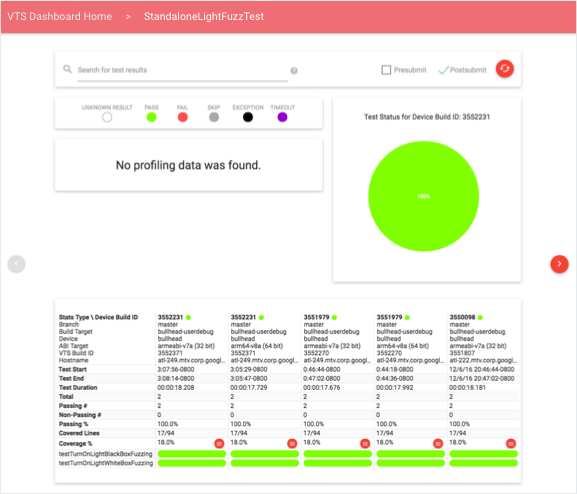
図 3. VTS ダッシュボード、テスト結果
ユーザーはクエリを使用して、またはテストタイプ(送信前、送信後、またはその両方)を変更することにより、データをフィルタできます。検索クエリは、一般的なトークンとフィールド固有の修飾子に対応しています。対応している検索フィールドは、デバイスビルド ID、ブランチ、ターゲット名、デバイス名、テストビルド ID です。これらは FIELD-ID="SEARCH QUERY" の形式で指定します。引用符は、複数の単語を 1 つのトークンとして扱い、列内のデータと照合するために使用します。
データのプロファイリング
ユーザーはプロファイリング ポイントを選択して、そのポイントの定量的データを折れ線グラフまたはヒストグラムで表示するインタラクティブなビューにアクセスできます(以下に例を示します)。デフォルトでビューには最新の情報が表示されますが、日付選択ツールを使用して特定の期間を読み込むこともできます。
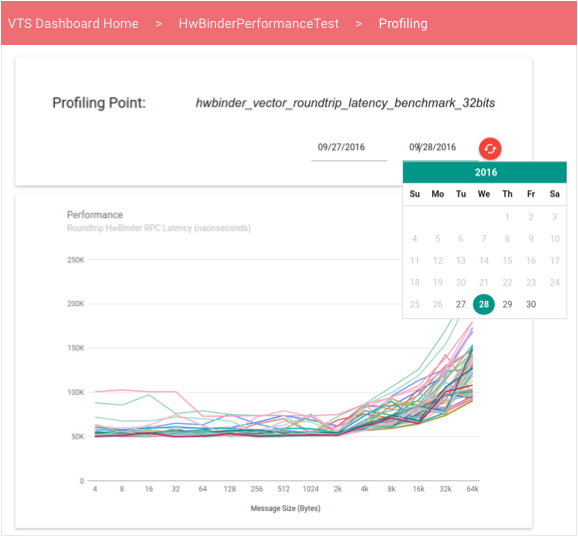
図 4. VTS ダッシュボード、パフォーマンスの折れ線グラフ
折れ線グラフは、順序付けられていないパフォーマンス値の集合から取得したデータを表示します。これは、パフォーマンスのテストによって、別の変数の関数として変化するパフォーマンス値(スループットとメッセージ サイズなど)のベクトルが生成される場合に有用な可能性があります。
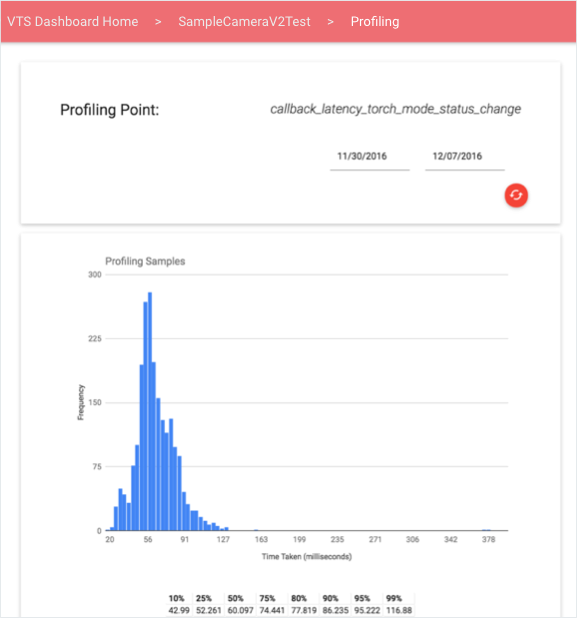
図 5. VTS ダッシュボード、パフォーマンスのヒストグラムテスト カバレッジ
テスト結果のカバレッジ率のリンクからカバレッジ情報を表示できます。
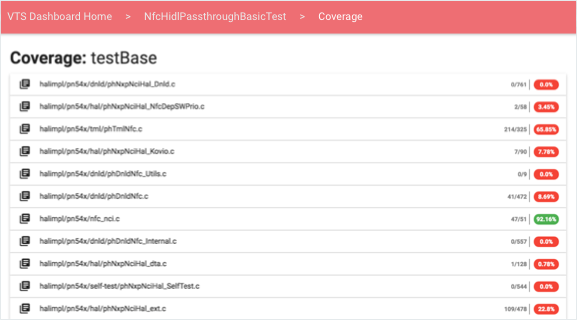
図 6. VTS ダッシュボード、カバレッジ率各テストケースとソースファイルを展開すると、次のように、選択したテストでのカバレッジに対応した色でソースコードが表示されます。
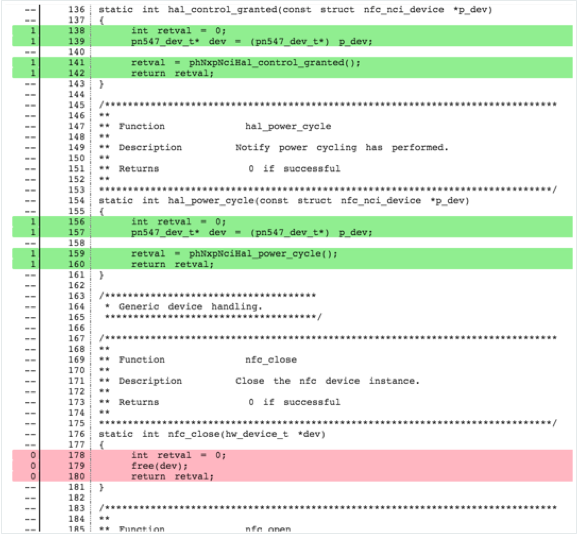
図 7. VTS ダッシュボード、ソースコードのカバレッジ
- 実行された行は、赤でハイライト表示されます。
- 実行されなかった行は、緑でハイライト表示されます。
- 実行できない行は、色付けされません。
カバレッジ情報は、実行時の取得方法に従ってセクションに分類されます。テストでは、次のカバレッジをアップロードできます。
- 関数ごと。セクション ヘッダーの形式は「Coverage: FUNCTION-NAME」です。
- 合計(テスト実行の最後に取得)。「Coverage: All」というヘッダーのみです。
ダッシュボードは、オープンソースの Gerrit REST API を使用するサーバーから、クライアント側でソースコードを取得します。
モニタリングとテスト
VTS ダッシュボードには、次のモニターとユニットテストが用意されています。
- テストのメールアラート。アラートは、2 分の固定間隔で実行される cron ジョブで設定されます。このジョブは、VTS ステータス テーブルを読み取り、各テーブルに新しいデータがアップロードされたかどうかを確認するために、テストの元データをアップロードしたときのタイムスタンプが、最後のステータス更新のタイムスタンプよりも新しいかどうかを判定します。アップロードのタイムスタンプの方が新しい場合、最後の元データのアップロードからその時点までにある新しいデータを照会します。新たなテストケースの失敗、継続的なテストケースの失敗、一時的なテストケースの失敗、テストケースの修正、非アクティブなテストが検出されます。この情報は各テストの登録者にメールで送信されます。
- ウェブサービスの健全性。Google Stackdriver を Google App Engine に統合することにより、VTS ダッシュボードを簡単にモニタリングできるようにしています。単純な稼働時間チェックでページにアクセスできるかどうかを確認できますが、他のテストを作成して、各ページ、サーブレット、データベースのレイテンシを確認することもできます。このチェックにより、ダッシュボードを常にアクセス可能な状態に保つことができます(アクセス可能でなければ管理者に通知されます)。
- 分析。ページ設定(pom.xml ファイル)で有効なアナリティクス ID を指定すると、VTS ダッシュボードのページを Google Cloud アナリティクスと統合できます。統合により、ページの使用状況、ユーザー操作、局所性、セッションの統計情報などに対して、より堅牢な分析を行うことが可能になります。
このページのコンテンツやコードサンプルは、コンテンツ ライセンスに記載のライセンスに従います。Java および OpenJDK は Oracle および関連会社の商標または登録商標です。
最終更新日 2025-07-27 UTC。
[[["わかりやすい","easyToUnderstand","thumb-up"],["問題の解決に役立った","solvedMyProblem","thumb-up"],["その他","otherUp","thumb-up"]],[["必要な情報がない","missingTheInformationINeed","thumb-down"],["複雑すぎる / 手順が多すぎる","tooComplicatedTooManySteps","thumb-down"],["最新ではない","outOfDate","thumb-down"],["翻訳に関する問題","translationIssue","thumb-down"],["サンプル / コードに問題がある","samplesCodeIssue","thumb-down"],["その他","otherDown","thumb-down"]],["最終更新日 2025-07-27 UTC。"],[],[],null,["# VTS Dashboard UI\n\nThe VTS Dashboard provides a cohesive user interface that uses material design\nto effectively display information about test results, profiling, and coverage.\nDashboard styling uses open-source Javascript libraries including Materialize\nCSS and jQueryUI to process data delivered by Java servlets in Google App\nEngine.\n\nDashboard home\n--------------\n\n\nThe Dashboard home page displays a list of test suites a user has added to\nfavorites.\n**Figure 1.** VTS Dashboard, home page.\n\n\nFrom this list, users can:\n\n- Select a test suite to view results for that suite.\n- Click **SHOW ALL** to view all VTS test names.\n- Select the **Edit** icon to modify the Favorites list. \n **Figure 2.** VTS Dashboard, editing Favorites page.\n\nTest results\n------------\n\n\nTest Results displays the latest information about the selected test suite,\nincluding a list of profiling points, a table of test case results in\nchronological order, and a pie chart displaying the result breakdown of the\nlatest run (users can load older data by paging right).\n**Figure 3.** VTS Dashboard, test results.\n\n\nUsers can filter data using queries or by modifying the test type (pre-submit,\npost-submit, or both). Search queries support general tokens and field-specific\nqualifiers; supported search fields are: device build ID, branch, target name,\ndevice name, and test build ID. These are specified in the format:\n\u003cvar translate=\"no\"\u003eFIELD-ID\u003c/var\u003e=\"\u003cvar translate=\"no\"\u003eSEARCH QUERY\u003c/var\u003e\". Quotes are used to treat multiple\nwords as a single token to match with the data in the columns.\n\nData profiling\n--------------\n\n\nUsers can select a profiling point to reach an interactive view of the\nquantitative data for that point in a **line graph** or\n**histogram** (examples below). By default, the view displays the\nlatest information; users can use the date picker to load specific time windows.\n**Figure 4.** VTS Dashboard, line graph performance.\n\n\nLine graphs display data from a collection of unordered performance values,\nwhich can be useful when a test of performance produces a vector of performance\nvalues that vary as a function of another variable (e.g., throughput versus\nmessage size).\n**Figure 5.** VTS Dashboard, histogram performance.\n\nTest coverage\n-------------\n\n\nUsers can view coverage information from the coverage percent link in test\nresults.\n**Figure 6.** VTS Dashboard, coverage percentages.\n\n\nFor each test case and source file, users can view an expandable element\ncontaining color-coded source code according to the coverage provided by the\nselected test:\n**Figure 7.** VTS Dashboard, coverage source code.\n\n- Uncovered lines are highlighted red.\n- Covered lines are highlighted green.\n- Non-executable lines are **uncolored**.\n\n\nCoverage information is grouped depending into sections depending on how it was\nprovided at run-time. Tests may upload coverage:\n\n- **Per function** . Section headers have the format \"Coverage: \u003cvar translate=\"no\"\u003eFUNCTION-NAME\u003c/var\u003e\".\n- **In Total** (provided at the end of the test run). Only one header is present: \"Coverage: All\".\n\n\nThe Dashboard fetches source code client-side from a server, which uses the\nopen-source\n[Gerrit REST API](https://gerrit-review.googlesource.com/Documentation/rest-api.html).\n\nMonitoring and testing\n----------------------\n\n\nThe VTS Dashboard provides the following monitors and unit tests.\n\n- **Test email alerts**. Alerts are configured in a Cron job that executes at a fixed interval of two (2) minutes. The job reads the VTS status table to determine if new data has been uploaded to each table, done by checking the test's raw data upload timestamp is newer than the last status update timestamp. If the upload timestamp is newer, the job queries for new data between now and the last raw data upload. New test case failures, continued test case failures, transient test case failures, test case fixes, an inactive tests are determined; this information is then sent in email format to the subscribers of each test.\n- **Web service health**. Google Stackdriver integrates with Google App Engine to provide easy monitoring of the VTS Dashboard. Simple uptime checks verify pages can be accessed while other tests can be created to verify latency on each page, servlet, or database. These checks ensure the Dashboard is always accessible (else an administrator will be notified).\n- **Analytics**. You can integrate a VTS Dashboard page with Google Cloud Analytics by specifying a valid Analytics ID in the page configuration (the pom.xml file). Integration provides a more robust analysis of page usage, user interaction, locality, session statistics, etc."]]