The VTS Dashboard provides a user backend and user interface (UI) for viewing test results from the VTS continuous integration system. It supports test-driven development with tools such as test status notifications to help developers to locate and prevent regression areas during the development cycle (include test monitoring and triaging support).
The VTS Dashboard UI supports features (such as native code coverage) provided by the VTS infrastructure and offers continuous performance monitoring to enable the development of optimized and well-characterized performance tools.
Requirements
The following services are required to use the VTS Dashboard:
- Apache Maven, for building and deployment
- Google Cloud App Engine, for web-service hosting
- Google Cloud Datastore, for storage
- Google Stackdriver, for monitoring
Viewing test coverage relies on a REST API to a source code server (e.g. Gerrit), which enables the web service to fetch original source code according to existing access control lists.
Architecture
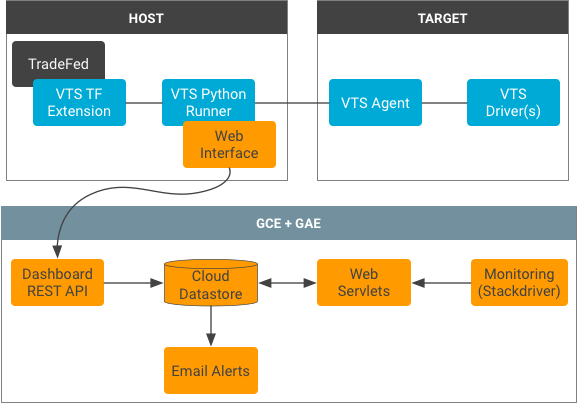
The VTS Dashboard uses the following architecture:

Test status results are continuously uploaded to the Cloud Datastore database via a REST interface. The VTS runner automatically processes the results and serializes them using the Protobuf format.
Web servlets form the primary access point for users, delivering and processing data from the Datastore database. The servlets include: a main servlet for delivering all of the tests, a preferences servlet for managing user favorites, a results servlet for populating a test table, a graph servlet for preparing profiling data, and a coverage servlet for preparing coverage data for the client.
Each test module has its own Datastore ancestry tree and test results are indexed with the Unix timestamp of the test start time. Coverage data in the database is stored with the test results as a vector of counts (i.e. for each line in the original source file) and identifying information to fetch the source code from a source code server.
The notification service runs using task queues, identifying test case status changes, and notifying subscribers. Stateful information is stored in a status table to keep track of data freshness and existing failures. This allows for the notification service to provide rich information about individual test case failures and fixes.
Code structure
VTS Dashboard essential components include the servlets implemented in Java,
the front-end JSPs, CSS stylesheets, and configuration files. The following list
details the locations and descriptions of these components (all paths relative
to test/vts/web/dashboard):
pom.xml
Settings file where environment variables and dependencies are defined.src/main/java/com/android/vts/api/
Contains endpoints for interacting with the data via REST.src/main/java/com/android/vts/entity/
Contains Java models of the Datastore entities.src/main/java/com/android/vts/proto/
Contains Java files for Protobuf, includingVtsReportMessage.java, which is a Java implementation of Protobuf type used to describe VTS test results.src/main/java/com/android/vts/servlet/
Contains Java files for servlets.src/main/java/com/android/vts/util/
Contains Java files for utility functions and classes used by the servlets.src/test/java/com/android/vts/
Contains UI tests for the servlets and utils.src/main/webapp/
Contains files related to the UI (JSP, CSS, XML):js/. Contains Javascript files used by the web pages.WEB-INF/. Contains configuration and UI files.jsp/. Contains the JSP files for each web page.
appengine-web.xml
Settings file where environment variables are loaded into variables.web.xml
Settings file where servlet mappings and security constraints are defined.cron.xml
Settings file defining scheduled tasks (i.e. the notifications service).
Set up the Dashboard
To set up the VTS Dashboard:
- Create a Google Cloud App Engine Project and set up the deployment host by
installing:
- Java 8
- Google App Engine SDK
- Maven
- Generate an OAuth 2.0 Client ID in the Google Cloud API Manager.
- Create a Service Account and create a keyfile.
- Add an email address to the App Engine Email API Authorized Senders List.
- Set up a Google Analytics Account.
- Specify environment variables in the Dashboard
pom.xml:- Set the client ID with the OAuth 2.0 ID (from step 2).
- Set the service client ID with the identifier included in the keyfile (from step 3).
- Specify the sender email address for alerts (from step 4).
- Specify an email domain to which all emails will be sent.
- Specify the address to the Gerrit REST server.
- Specify the OAuth 2.0 scope to use for the Gerrit REST server.
- Specify the Google Analytics ID (from step 5).
- Build and deploy the project.
- In a terminal, run
mvn clean appengine:update.
Security considerations
Robust coverage information requires access to the original source code. However, some code may be sensitive and an additional gateway to it may allow for exploitation of existing access control lists.
To avoid this threat, instead of serving the source code with the coverage information, the Dashboard directly handles a coverage vector (i.e., a vector of execution counts mapping to lines in a source file). Along with the coverage vector, the Dashboard receives a Git project name and path so the client can fetch the code from an external source code API. The client browser receives this information and uses cross-origin resource sharing (CORS) in Javascript to query the source code server for the original source code; the resulting code is combined with the coverage vector to produce a display.
This direct approach does not widen the attack surface because the Dashboard uses the user's cookies to authenticate with an outside service (meaning a user who cannot access source code directly cannot exploit the Dashboard to view sensitive information).
