ตั้งแต่วันที่ 27 มีนาคม 2025 เป็นต้นไป เราขอแนะนำให้ใช้ android-latest-release
แทน aosp-main
เพื่อสร้างและมีส่วนร่วมใน AOSP โปรดดูข้อมูลเพิ่มเติมที่หัวข้อการเปลี่ยนแปลงใน AOSP
UI ของแดชบอร์ด VTS
จัดทุกอย่างให้เป็นระเบียบอยู่เสมอด้วยคอลเล็กชัน
บันทึกและจัดหมวดหมู่เนื้อหาตามค่ากำหนดของคุณ
แดชบอร์ด VTS มีอินเทอร์เฟซผู้ใช้ที่เชื่อมโยงกันโดยใช้ Material Design เพื่อแสดงข้อมูลเกี่ยวกับผลการทดสอบ การสร้างโปรไฟล์ และการครอบคลุมอย่างมีประสิทธิภาพ
การจัดสไตล์หน้าแดชบอร์ดใช้ไลบรารี JavaScript แบบโอเพนซอร์ส ซึ่งรวมถึง Materialize CSS และ jQueryUI เพื่อประมวลผลข้อมูลที่เซิร์ฟเลต Java นำมาใน Google App Engine
หน้าแรกของแดชบอร์ด
หน้าแรกของแดชบอร์ดจะแสดงรายการชุดทดสอบที่ผู้ใช้เพิ่มลงในรายการโปรด
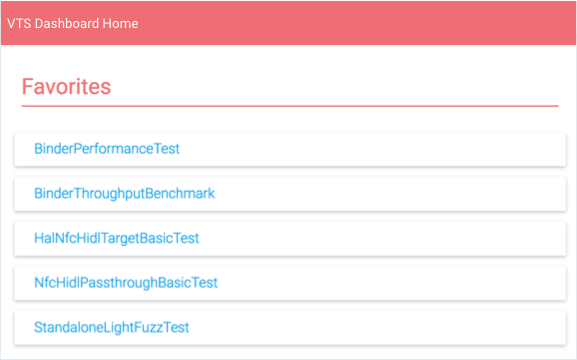
รูปที่ 1 หน้าแรกของแดชบอร์ด VTS
ผู้ใช้จะทำสิ่งต่อไปนี้ได้จากรายการนี้
- เลือกชุดทดสอบเพื่อดูผลลัพธ์ของชุดนั้น
- คลิกแสดงทั้งหมดเพื่อดูชื่อการทดสอบ VTS ทั้งหมด
- เลือกไอคอนแก้ไขเพื่อแก้ไขรายการรายการโปรด
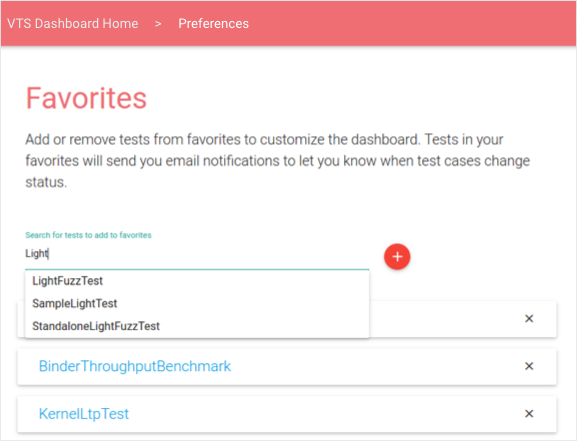
รูปที่ 2 แดชบอร์ด VTS การแก้ไขหน้ารายการโปรด
ผลการทดสอบ
ผลการทดสอบจะแสดงข้อมูลล่าสุดเกี่ยวกับชุดทดสอบที่เลือก รวมถึงรายการจุดโปรไฟล์ ตารางผลลัพธ์ของกรณีทดสอบตามลําดับเวลา และแผนภูมิวงกลมที่แสดงรายละเอียดผลลัพธ์ของการเรียกใช้ครั้งล่าสุด (ผู้ใช้สามารถโหลดข้อมูลเก่าได้โดยกดแป้นลูกศรขวา)
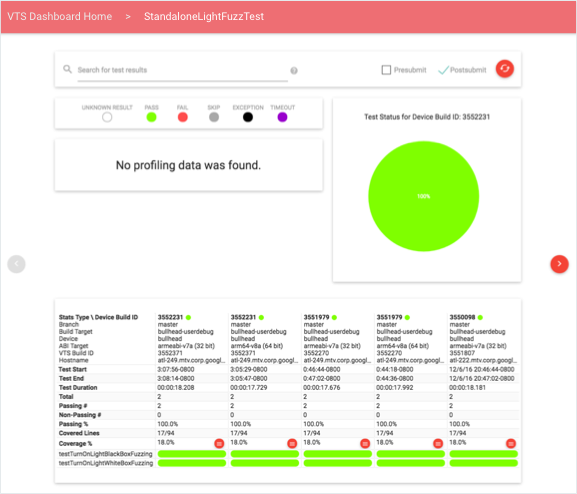
รูปที่ 3 แดชบอร์ด VTS, ผลการทดสอบ
ผู้ใช้สามารถกรองข้อมูลโดยใช้การค้นหาหรือแก้ไขประเภทการทดสอบ (ก่อนส่ง ส่งแล้ว หรือทั้ง 2 อย่าง) คําค้นหารองรับโทเค็นทั่วไปและตัวระบุเฉพาะช่อง ช่องการค้นหาที่รองรับ ได้แก่ รหัสบิลด์ของอุปกรณ์ สาขา ชื่อเป้าหมาย ชื่ออุปกรณ์ และรหัสบิลด์ทดสอบ โดยระบุในรูปแบบ FIELD-ID="SEARCH QUERY" โดยใช้เครื่องหมายคำพูดเพื่อจัดการคำหลายคำเป็นโทเค็นเดียวเพื่อจับคู่กับข้อมูลในคอลัมน์
การสร้างโปรไฟล์ข้อมูล
ผู้ใช้สามารถเลือกจุดที่กําหนดโปรไฟล์เพื่อไปยังมุมมองอินเทอร์แอกทีฟของข้อมูลเชิงปริมาณสําหรับจุดนั้นในกราฟเส้นหรือฮิสโตแกรม (ดูตัวอย่างด้านล่าง) โดยค่าเริ่มต้น มุมมองจะแสดงข้อมูลล่าสุด ผู้ใช้สามารถใช้เครื่องมือเลือกวันที่เพื่อโหลดกรอบเวลาที่ต้องการ
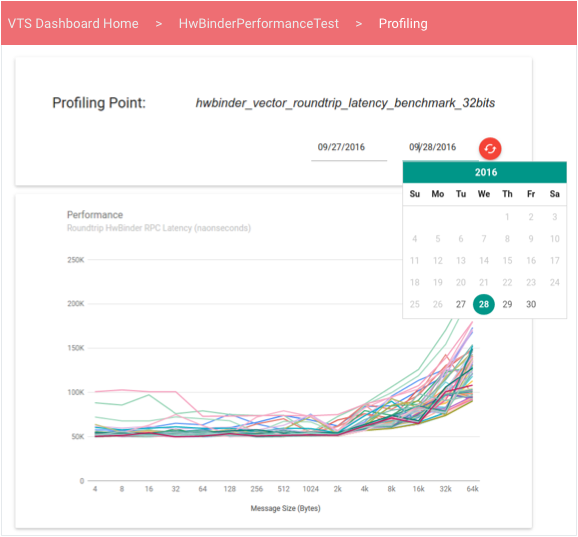
รูปที่ 4 แดชบอร์ด VTS, ประสิทธิภาพกราฟเส้น
แผนภูมิเส้นแสดงข้อมูลจากคอลเล็กชันค่าประสิทธิภาพที่ไม่มีลําดับ ซึ่งจะมีประโยชน์เมื่อการทดสอบประสิทธิภาพสร้างเวกเตอร์ของค่าประสิทธิภาพที่ผันแปรตามฟังก์ชันของตัวแปรอื่น (เช่น ปริมาณงานเทียบกับขนาดข้อความ)
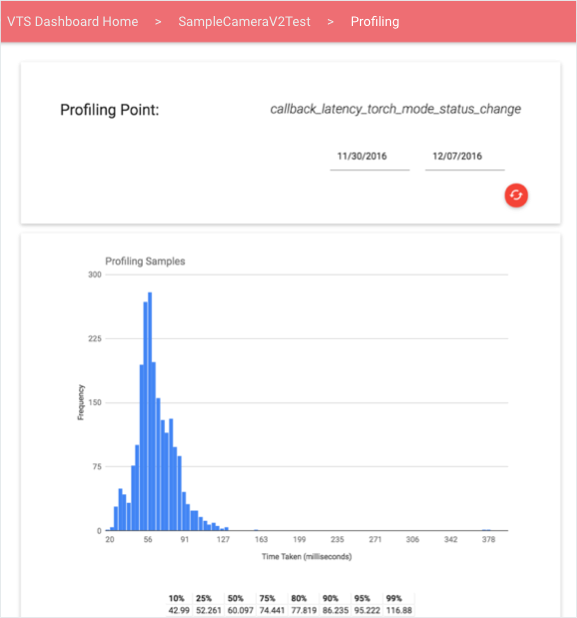
รูปที่ 5 แดชบอร์ด VTS, ประสิทธิภาพฮิสโตแกรม
การครอบคลุมการทดสอบ
ผู้ใช้ดูข้อมูลความครอบคลุมได้จากลิงก์เปอร์เซ็นต์ความครอบคลุมในผลการทดสอบ
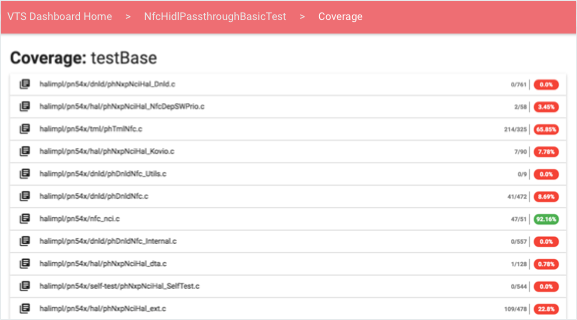
รูปที่ 6 แดชบอร์ด VTS, เปอร์เซ็นต์การครอบคลุม
สําหรับแต่ละกรณีทดสอบและไฟล์ต้นทาง ผู้ใช้สามารถดูองค์ประกอบที่ขยายได้ซึ่งมีซอร์สโค้ดที่มีรหัสสีตามความครอบคลุมที่การทดสอบที่เลือกระบุไว้ ดังนี้
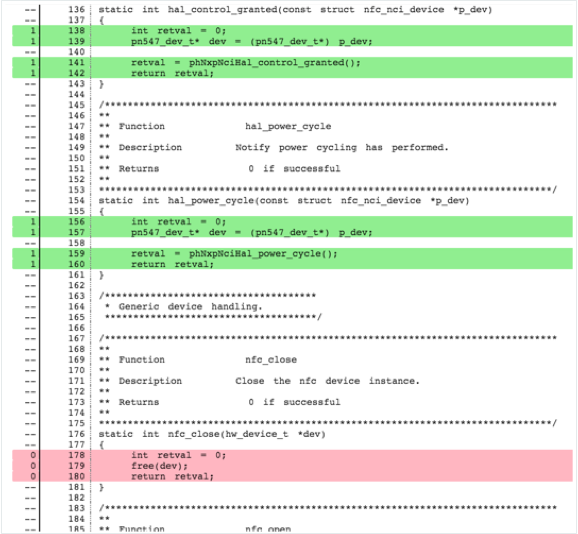
รูปที่ 7 แดชบอร์ด VTS, ซอร์สโค้ดความครอบคลุม
- ระบบจะไฮไลต์บรรทัดที่ยังไม่ได้ครอบคลุมเป็นสีแดง
- เส้นที่ครอบคลุมจะไฮไลต์เป็นสีเขียว
- บรรทัดที่ไม่สามารถเรียกใช้ได้จะไม่มีสี
ระบบจะจัดกลุ่มข้อมูลความครอบคลุมออกเป็นส่วนๆ โดยขึ้นอยู่กับวิธีที่ระบุข้อมูลดังกล่าวเมื่อรันไทม์ การทดสอบอาจอัปโหลดการครอบคลุมในกรณีต่อไปนี้
- ต่อฟังก์ชัน ส่วนหัวของส่วนมีรูปแบบเป็น "ความครอบคลุม:
FUNCTION-NAME"
- ทั้งหมด (แสดงเมื่อสิ้นสุดการทดสอบ) มีส่วนหัวเพียงรายการเดียวคือ "ความครอบคลุม: ทั้งหมด"
แดชบอร์ดจะดึงข้อมูลซอร์สโค้ดฝั่งไคลเอ็นต์จากเซิร์ฟเวอร์ที่ใช้ Gerrit REST API แบบโอเพนซอร์ส
การตรวจสอบและการทดสอบ
แดชบอร์ด VTS มีเครื่องมือตรวจสอบและยูนิตเทสต์ต่อไปนี้
- ทดสอบการแจ้งเตือนทางอีเมล การแจ้งเตือนได้รับการกําหนดค่าในงาน Cron ที่ทํางานเป็นระยะๆ คงที่ 2 (2) นาที งานจะอ่านตารางสถานะ VTS เพื่อระบุว่ามีการอัปโหลดข้อมูลใหม่ไปยังแต่ละตารางหรือไม่ โดยตรวจสอบการประทับเวลาการอัปโหลดข้อมูลดิบของการทดสอบใหม่กว่าการประทับเวลาการอัปเดตสถานะครั้งล่าสุดหรือไม่ หากการประทับเวลาการอัปโหลดใหม่กว่า งานจะค้นหาข้อมูลใหม่ระหว่างนี้กับการอัปโหลดข้อมูลดิบครั้งล่าสุด ระบบจะระบุข้อผิดพลาดของเฟรมทดสอบใหม่ ข้อผิดพลาดของเฟรมทดสอบอย่างต่อเนื่อง ข้อผิดพลาดของเฟรมทดสอบชั่วคราว การแก้ไขเฟรมทดสอบ การทดสอบที่ไม่ทำงาน จากนั้นจะส่งข้อมูลนี้ในรูปแบบอีเมลไปยังผู้สมัครใช้บริการของการทดสอบแต่ละรายการ
- ประสิทธิภาพของเว็บเซอร์วิส Google Stackdriver ผสานรวมกับ Google App Engine เพื่อให้ตรวจสอบแดชบอร์ด VTS ได้อย่างง่ายดาย การตรวจสอบการทํางานอยู่เสมอแบบง่ายจะยืนยันว่าเข้าถึงหน้าเว็บได้ ขณะที่สร้างการทดสอบอื่นๆ เพื่อยืนยันเวลาในการตอบสนองในแต่ละหน้า เซิร์ฟเล็ต หรือฐานข้อมูล การตรวจสอบเหล่านี้ช่วยให้มั่นใจได้ว่าแดชบอร์ดจะเข้าถึงได้เสมอ (มิเช่นนั้นผู้ดูแลระบบจะได้รับการแจ้งเตือน)
- Analytics คุณสามารถผสานรวมหน้าแดชบอร์ด VTS กับ Google Cloud Analytics ได้โดยระบุรหัส Analytics ที่ถูกต้องในการกําหนดค่าหน้าเว็บ (ไฟล์ pom.xml) การผสานรวมช่วยให้การวิเคราะห์การใช้งานหน้าเว็บ การโต้ตอบของผู้ใช้ สถานที่ตั้ง สถิติเซสชัน ฯลฯ มีประสิทธิภาพมากขึ้น
ตัวอย่างเนื้อหาและโค้ดในหน้าเว็บนี้ขึ้นอยู่กับใบอนุญาตที่อธิบายไว้ในใบอนุญาตการใช้เนื้อหา Java และ OpenJDK เป็นเครื่องหมายการค้าหรือเครื่องหมายการค้าจดทะเบียนของ Oracle และ/หรือบริษัทในเครือ
อัปเดตล่าสุด 2025-07-27 UTC
[[["เข้าใจง่าย","easyToUnderstand","thumb-up"],["แก้ปัญหาของฉันได้","solvedMyProblem","thumb-up"],["อื่นๆ","otherUp","thumb-up"]],[["ไม่มีข้อมูลที่ฉันต้องการ","missingTheInformationINeed","thumb-down"],["ซับซ้อนเกินไป/มีหลายขั้นตอนมากเกินไป","tooComplicatedTooManySteps","thumb-down"],["ล้าสมัย","outOfDate","thumb-down"],["ปัญหาเกี่ยวกับการแปล","translationIssue","thumb-down"],["ตัวอย่าง/ปัญหาเกี่ยวกับโค้ด","samplesCodeIssue","thumb-down"],["อื่นๆ","otherDown","thumb-down"]],["อัปเดตล่าสุด 2025-07-27 UTC"],[],[],null,["# VTS Dashboard UI\n\nThe VTS Dashboard provides a cohesive user interface that uses material design\nto effectively display information about test results, profiling, and coverage.\nDashboard styling uses open-source Javascript libraries including Materialize\nCSS and jQueryUI to process data delivered by Java servlets in Google App\nEngine.\n\nDashboard home\n--------------\n\n\nThe Dashboard home page displays a list of test suites a user has added to\nfavorites.\n**Figure 1.** VTS Dashboard, home page.\n\n\nFrom this list, users can:\n\n- Select a test suite to view results for that suite.\n- Click **SHOW ALL** to view all VTS test names.\n- Select the **Edit** icon to modify the Favorites list. \n **Figure 2.** VTS Dashboard, editing Favorites page.\n\nTest results\n------------\n\n\nTest Results displays the latest information about the selected test suite,\nincluding a list of profiling points, a table of test case results in\nchronological order, and a pie chart displaying the result breakdown of the\nlatest run (users can load older data by paging right).\n**Figure 3.** VTS Dashboard, test results.\n\n\nUsers can filter data using queries or by modifying the test type (pre-submit,\npost-submit, or both). Search queries support general tokens and field-specific\nqualifiers; supported search fields are: device build ID, branch, target name,\ndevice name, and test build ID. These are specified in the format:\n\u003cvar translate=\"no\"\u003eFIELD-ID\u003c/var\u003e=\"\u003cvar translate=\"no\"\u003eSEARCH QUERY\u003c/var\u003e\". Quotes are used to treat multiple\nwords as a single token to match with the data in the columns.\n\nData profiling\n--------------\n\n\nUsers can select a profiling point to reach an interactive view of the\nquantitative data for that point in a **line graph** or\n**histogram** (examples below). By default, the view displays the\nlatest information; users can use the date picker to load specific time windows.\n**Figure 4.** VTS Dashboard, line graph performance.\n\n\nLine graphs display data from a collection of unordered performance values,\nwhich can be useful when a test of performance produces a vector of performance\nvalues that vary as a function of another variable (e.g., throughput versus\nmessage size).\n**Figure 5.** VTS Dashboard, histogram performance.\n\nTest coverage\n-------------\n\n\nUsers can view coverage information from the coverage percent link in test\nresults.\n**Figure 6.** VTS Dashboard, coverage percentages.\n\n\nFor each test case and source file, users can view an expandable element\ncontaining color-coded source code according to the coverage provided by the\nselected test:\n**Figure 7.** VTS Dashboard, coverage source code.\n\n- Uncovered lines are highlighted red.\n- Covered lines are highlighted green.\n- Non-executable lines are **uncolored**.\n\n\nCoverage information is grouped depending into sections depending on how it was\nprovided at run-time. Tests may upload coverage:\n\n- **Per function** . Section headers have the format \"Coverage: \u003cvar translate=\"no\"\u003eFUNCTION-NAME\u003c/var\u003e\".\n- **In Total** (provided at the end of the test run). Only one header is present: \"Coverage: All\".\n\n\nThe Dashboard fetches source code client-side from a server, which uses the\nopen-source\n[Gerrit REST API](https://gerrit-review.googlesource.com/Documentation/rest-api.html).\n\nMonitoring and testing\n----------------------\n\n\nThe VTS Dashboard provides the following monitors and unit tests.\n\n- **Test email alerts**. Alerts are configured in a Cron job that executes at a fixed interval of two (2) minutes. The job reads the VTS status table to determine if new data has been uploaded to each table, done by checking the test's raw data upload timestamp is newer than the last status update timestamp. If the upload timestamp is newer, the job queries for new data between now and the last raw data upload. New test case failures, continued test case failures, transient test case failures, test case fixes, an inactive tests are determined; this information is then sent in email format to the subscribers of each test.\n- **Web service health**. Google Stackdriver integrates with Google App Engine to provide easy monitoring of the VTS Dashboard. Simple uptime checks verify pages can be accessed while other tests can be created to verify latency on each page, servlet, or database. These checks ensure the Dashboard is always accessible (else an administrator will be notified).\n- **Analytics**. You can integrate a VTS Dashboard page with Google Cloud Analytics by specifying a valid Analytics ID in the page configuration (the pom.xml file). Integration provides a more robust analysis of page usage, user interaction, locality, session statistics, etc."]]