自 2025 年 3 月 27 日起,我們建議您使用 android-latest-release
而非 aosp-main
建構及貢獻 AOSP。詳情請參閱「Android 開放原始碼計畫變更」。
VTS 資訊主頁 UI
透過集合功能整理內容
你可以依據偏好儲存及分類內容。
VTS 資訊主頁提供整合式使用者介面,採用 Material Design 設計,有效顯示測試結果、剖析和涵蓋率的相關資訊。資訊主頁樣式會使用開放原始碼 JavaScript 程式庫 (包括 Materialize CSS 和 jQueryUI),處理 Google App Engine 中 Java Servlet 提供的資料。
資訊主頁
資訊主頁首頁會顯示使用者已加入至收藏清單的測試套件清單。
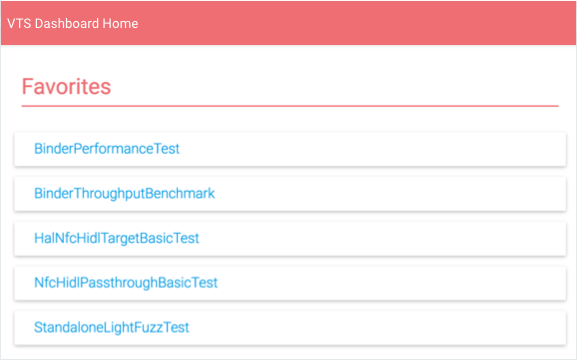
圖 1. VTS 資訊主頁,首頁。
使用者可以透過這份清單執行下列操作:
- 選取測試套件,即可查看該套件的結果。
- 按一下「顯示全部」即可查看所有 VTS 測試名稱。
- 選取「編輯」圖示,即可修改「我的最愛」清單。
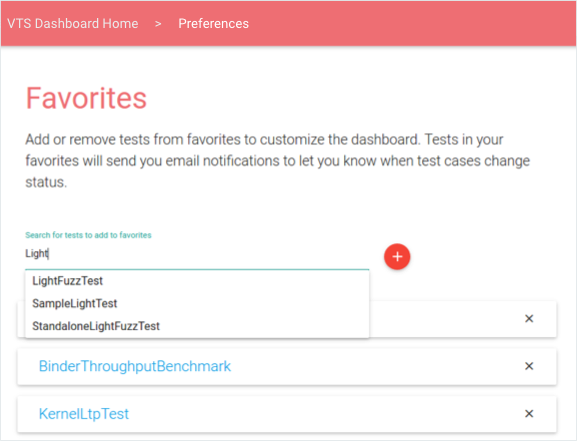
圖 2. VTS 資訊主頁,編輯「我的最愛」頁面。
測試結果
「測試結果」會顯示所選測試套件的最新資訊,包括剖析點清單、以時間順序排列的測試案例結果表格,以及顯示最近執行結果的圓餅圖 (使用者可以透過右頁面載入較舊的資料)。
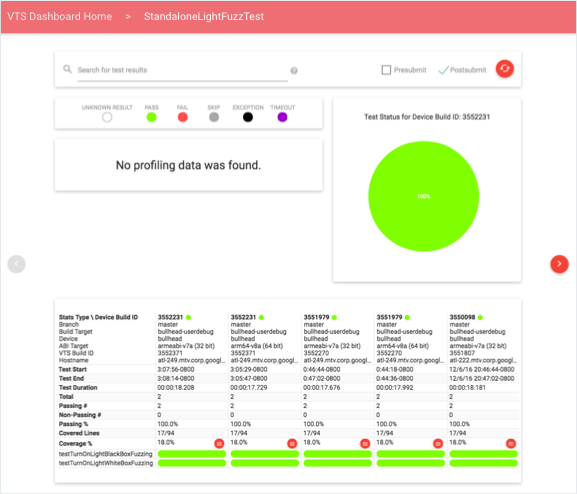
圖 3. VTS 資訊主頁,測試結果。
使用者可以使用查詢或修改測試類型 (提交前、提交後,或兩者皆是) 來篩選資料。搜尋查詢支援一般符記和欄位專屬限定詞;支援的搜尋欄位包括:裝置版本 ID、分支、目標名稱、裝置名稱和測試版本 ID。這些參數的格式為:FIELD-ID="SEARCH QUERY"。引號用於將多個字詞視為單一符記,以便與資料欄中的資料比對。
資料剖析
使用者可以選取剖析點,以便在線圖或直方圖中,以互動式檢視畫面查看該點的定量資料 (如下所示)。根據預設,檢視畫面會顯示最新資訊;使用者可以使用日期挑選器載入特定時間範圍。
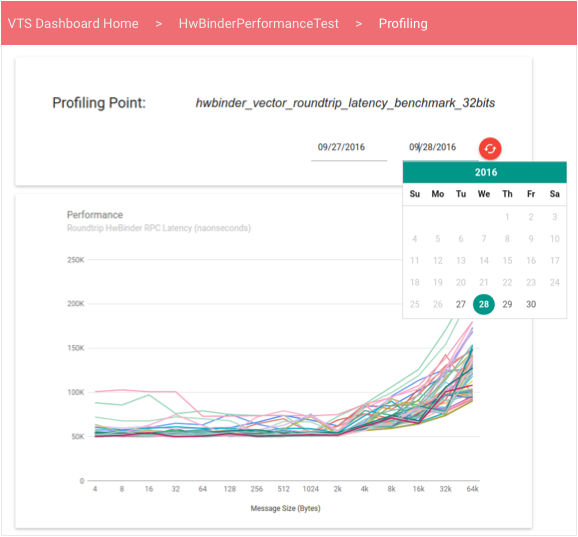
圖 4. VTS 資訊主頁,成效折線圖。
線型圖會顯示一組未排序成效值的資料,這在成效測試產生成效值向量時很實用,這些值會根據其他變數 (例如傳輸量與訊息大小) 而變化。
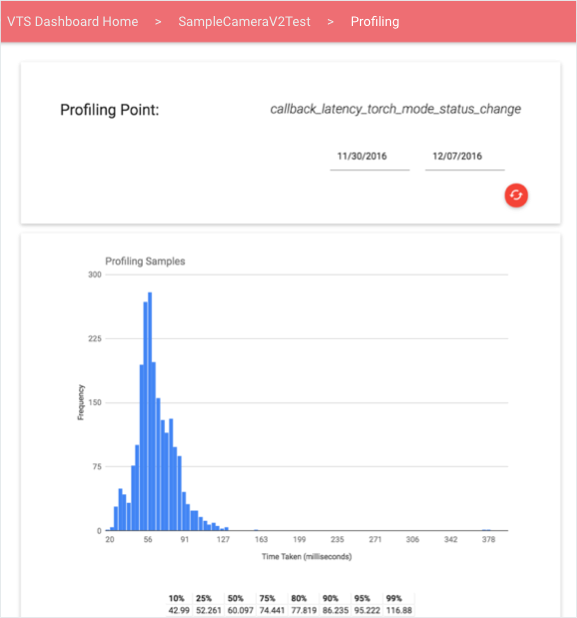
圖 5. VTS 資訊主頁的直方圖成效。測試涵蓋率
使用者可以透過測試結果中的涵蓋率百分比連結查看涵蓋率資訊。
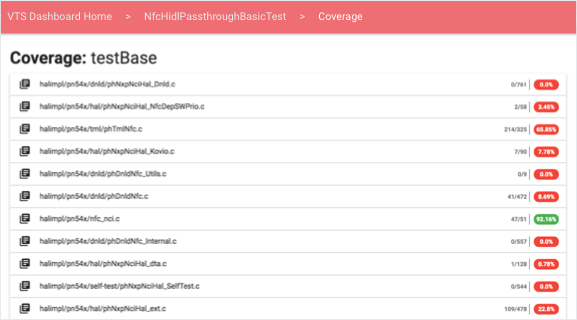
圖 6. VTS 資訊主頁,涵蓋率百分比。
針對每個測試案例和來源檔案,使用者可以根據所選測試提供的涵蓋率,查看包含色彩編碼原始碼的可展開元素:
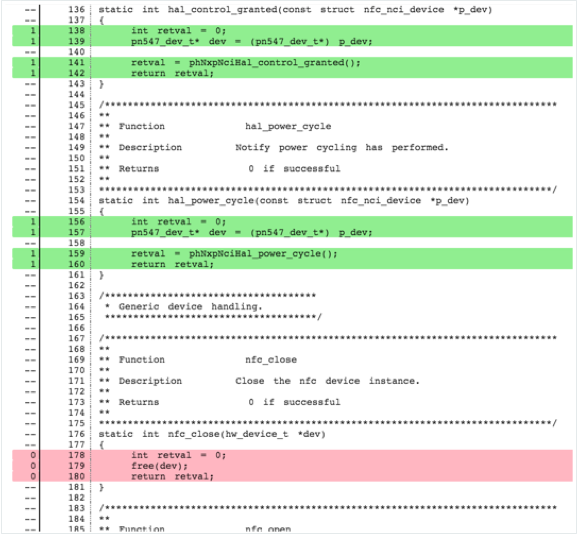
圖 7. VTS 資訊主頁、涵蓋率原始碼。
- 未覆蓋的線條會以紅色標示。
- 已測試的程式碼行會以 綠色標示。
- 非可執行行則不會著色。
系統會根據在執行階段提供的方式,將涵蓋率資訊分組為幾個部分。測試可能會上傳涵蓋率:
- 每個函式。版面配置標題的格式為「Coverage: FUNCTION-NAME」。
- 總計 (在測試結束時提供)。只有一個標頭:「Coverage: All」。
資訊主頁會從伺服器擷取原始碼用戶端,該伺服器會使用開源 Gerrit REST API。
監控和測試
VTS 資訊主頁提供下列監控器和單元測試。
- 測試電子郵件快訊。警示會在 Cron 工作中設定,以便以兩 (2) 分鐘的固定間隔執行。工作會讀取 VTS 狀態表,判斷是否已將新資料上傳至各個表格,方法是檢查測試的原始資料上傳時間戳記是否比上次狀態更新時間戳記更新。如果上傳時間戳記較新,工作會在目前與上次上傳原始資料之間查詢新資料。系統會判斷新測試案例失敗、持續測試案例失敗、暫時性測試案例失敗、測試案例修正、非活動測試;然後以電子郵件格式將這項資訊傳送給各測試的訂閱者。
- 網路服務健全度。Google Stackdriver 與 Google App Engine 整合,可輕鬆監控 VTS 資訊主頁。簡單的運作時間檢查可驗證網頁是否可供存取,您也可以建立其他測試,驗證各個網頁、Servlet 或資料庫的延遲時間。這些檢查可確保 Dashboard 一律可供存取 (否則管理員會收到通知)。
- Analytics。您可以在頁面設定 (pom.xml 檔案) 中指定有效的 Analytics ID,將 VTS 資訊主頁整合至 Google Cloud Analytics。整合後,您就能更全面地分析網頁使用情形、使用者互動、地區、工作階段統計資料等。
這個頁面中的內容和程式碼範例均受《內容授權》中的授權所規範。Java 與 OpenJDK 是 Oracle 和/或其關係企業的商標或註冊商標。
上次更新時間:2025-07-27 (世界標準時間)。
[[["容易理解","easyToUnderstand","thumb-up"],["確實解決了我的問題","solvedMyProblem","thumb-up"],["其他","otherUp","thumb-up"]],[["缺少我需要的資訊","missingTheInformationINeed","thumb-down"],["過於複雜/步驟過多","tooComplicatedTooManySteps","thumb-down"],["過時","outOfDate","thumb-down"],["翻譯問題","translationIssue","thumb-down"],["示例/程式碼問題","samplesCodeIssue","thumb-down"],["其他","otherDown","thumb-down"]],["上次更新時間:2025-07-27 (世界標準時間)。"],[],[],null,["# VTS Dashboard UI\n\nThe VTS Dashboard provides a cohesive user interface that uses material design\nto effectively display information about test results, profiling, and coverage.\nDashboard styling uses open-source Javascript libraries including Materialize\nCSS and jQueryUI to process data delivered by Java servlets in Google App\nEngine.\n\nDashboard home\n--------------\n\n\nThe Dashboard home page displays a list of test suites a user has added to\nfavorites.\n**Figure 1.** VTS Dashboard, home page.\n\n\nFrom this list, users can:\n\n- Select a test suite to view results for that suite.\n- Click **SHOW ALL** to view all VTS test names.\n- Select the **Edit** icon to modify the Favorites list. \n **Figure 2.** VTS Dashboard, editing Favorites page.\n\nTest results\n------------\n\n\nTest Results displays the latest information about the selected test suite,\nincluding a list of profiling points, a table of test case results in\nchronological order, and a pie chart displaying the result breakdown of the\nlatest run (users can load older data by paging right).\n**Figure 3.** VTS Dashboard, test results.\n\n\nUsers can filter data using queries or by modifying the test type (pre-submit,\npost-submit, or both). Search queries support general tokens and field-specific\nqualifiers; supported search fields are: device build ID, branch, target name,\ndevice name, and test build ID. These are specified in the format:\n\u003cvar translate=\"no\"\u003eFIELD-ID\u003c/var\u003e=\"\u003cvar translate=\"no\"\u003eSEARCH QUERY\u003c/var\u003e\". Quotes are used to treat multiple\nwords as a single token to match with the data in the columns.\n\nData profiling\n--------------\n\n\nUsers can select a profiling point to reach an interactive view of the\nquantitative data for that point in a **line graph** or\n**histogram** (examples below). By default, the view displays the\nlatest information; users can use the date picker to load specific time windows.\n**Figure 4.** VTS Dashboard, line graph performance.\n\n\nLine graphs display data from a collection of unordered performance values,\nwhich can be useful when a test of performance produces a vector of performance\nvalues that vary as a function of another variable (e.g., throughput versus\nmessage size).\n**Figure 5.** VTS Dashboard, histogram performance.\n\nTest coverage\n-------------\n\n\nUsers can view coverage information from the coverage percent link in test\nresults.\n**Figure 6.** VTS Dashboard, coverage percentages.\n\n\nFor each test case and source file, users can view an expandable element\ncontaining color-coded source code according to the coverage provided by the\nselected test:\n**Figure 7.** VTS Dashboard, coverage source code.\n\n- Uncovered lines are highlighted red.\n- Covered lines are highlighted green.\n- Non-executable lines are **uncolored**.\n\n\nCoverage information is grouped depending into sections depending on how it was\nprovided at run-time. Tests may upload coverage:\n\n- **Per function** . Section headers have the format \"Coverage: \u003cvar translate=\"no\"\u003eFUNCTION-NAME\u003c/var\u003e\".\n- **In Total** (provided at the end of the test run). Only one header is present: \"Coverage: All\".\n\n\nThe Dashboard fetches source code client-side from a server, which uses the\nopen-source\n[Gerrit REST API](https://gerrit-review.googlesource.com/Documentation/rest-api.html).\n\nMonitoring and testing\n----------------------\n\n\nThe VTS Dashboard provides the following monitors and unit tests.\n\n- **Test email alerts**. Alerts are configured in a Cron job that executes at a fixed interval of two (2) minutes. The job reads the VTS status table to determine if new data has been uploaded to each table, done by checking the test's raw data upload timestamp is newer than the last status update timestamp. If the upload timestamp is newer, the job queries for new data between now and the last raw data upload. New test case failures, continued test case failures, transient test case failures, test case fixes, an inactive tests are determined; this information is then sent in email format to the subscribers of each test.\n- **Web service health**. Google Stackdriver integrates with Google App Engine to provide easy monitoring of the VTS Dashboard. Simple uptime checks verify pages can be accessed while other tests can be created to verify latency on each page, servlet, or database. These checks ensure the Dashboard is always accessible (else an administrator will be notified).\n- **Analytics**. You can integrate a VTS Dashboard page with Google Cloud Analytics by specifying a valid Analytics ID in the page configuration (the pom.xml file). Integration provides a more robust analysis of page usage, user interaction, locality, session statistics, etc."]]